☰
Current Page
Main Menu
Home
Home
Editing 2.0-Quick-Start
Edit
Preview
H1
H2
H3
default
Set your preferred keybinding
default
vim
emacs
markdown
Set this page's format to
AsciiDoc
Creole
Markdown
MediaWiki
Org-mode
Plain Text
RDoc
Textile
Rendering unavailable for
BibTeX
Pod
reStructuredText
Help 1
Help 1
Help 1
Help 2
Help 3
Help 4
Help 5
Help 6
Help 7
Help 8
Autosaved text is available. Click the button to restore it.
Restore Text
#2.0 Quick Start Guide [[_TOC_]] ##About The following section will demonstrate the basic capabilities of the Report Designer and how to create both simple and advanced reports. ##2.1 Building your first report Before we begin creating a new report, you can visit our [[demo site|http://www.izenda.com/bi/ReportList.aspx]] to begin following along. Once you have done that, come back to this guide and follow the additional steps. Alternately, you can watch the video below to begin creating your first report (redirects to youtube). [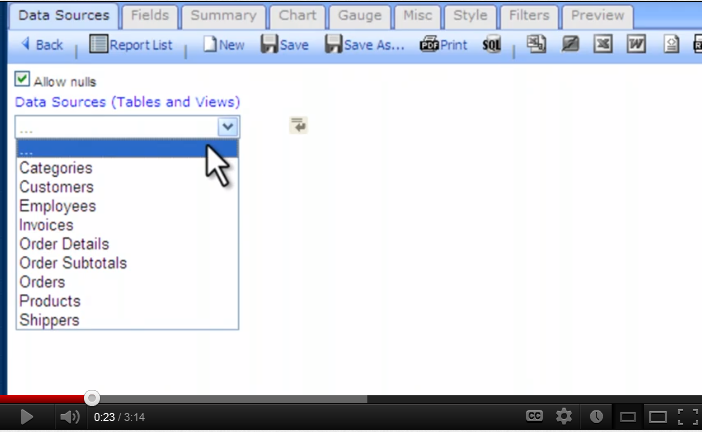](https://www.youtube.com/watch?v=N3uY9hi2UNQ&feature=youtu.be) To begin creating a new report, simply click the "+New" button on the Report List. You will then select "Report" from the menu that appears. You will be directed to the Report Designer. Here, you will see that you have landed on the [[Data Sources tab|/Guides/ReportDesign/3.0-Data-sources-tab]]. More information is available by clicking the link. For now, select **Orders**. Then click "Continue to Fields". 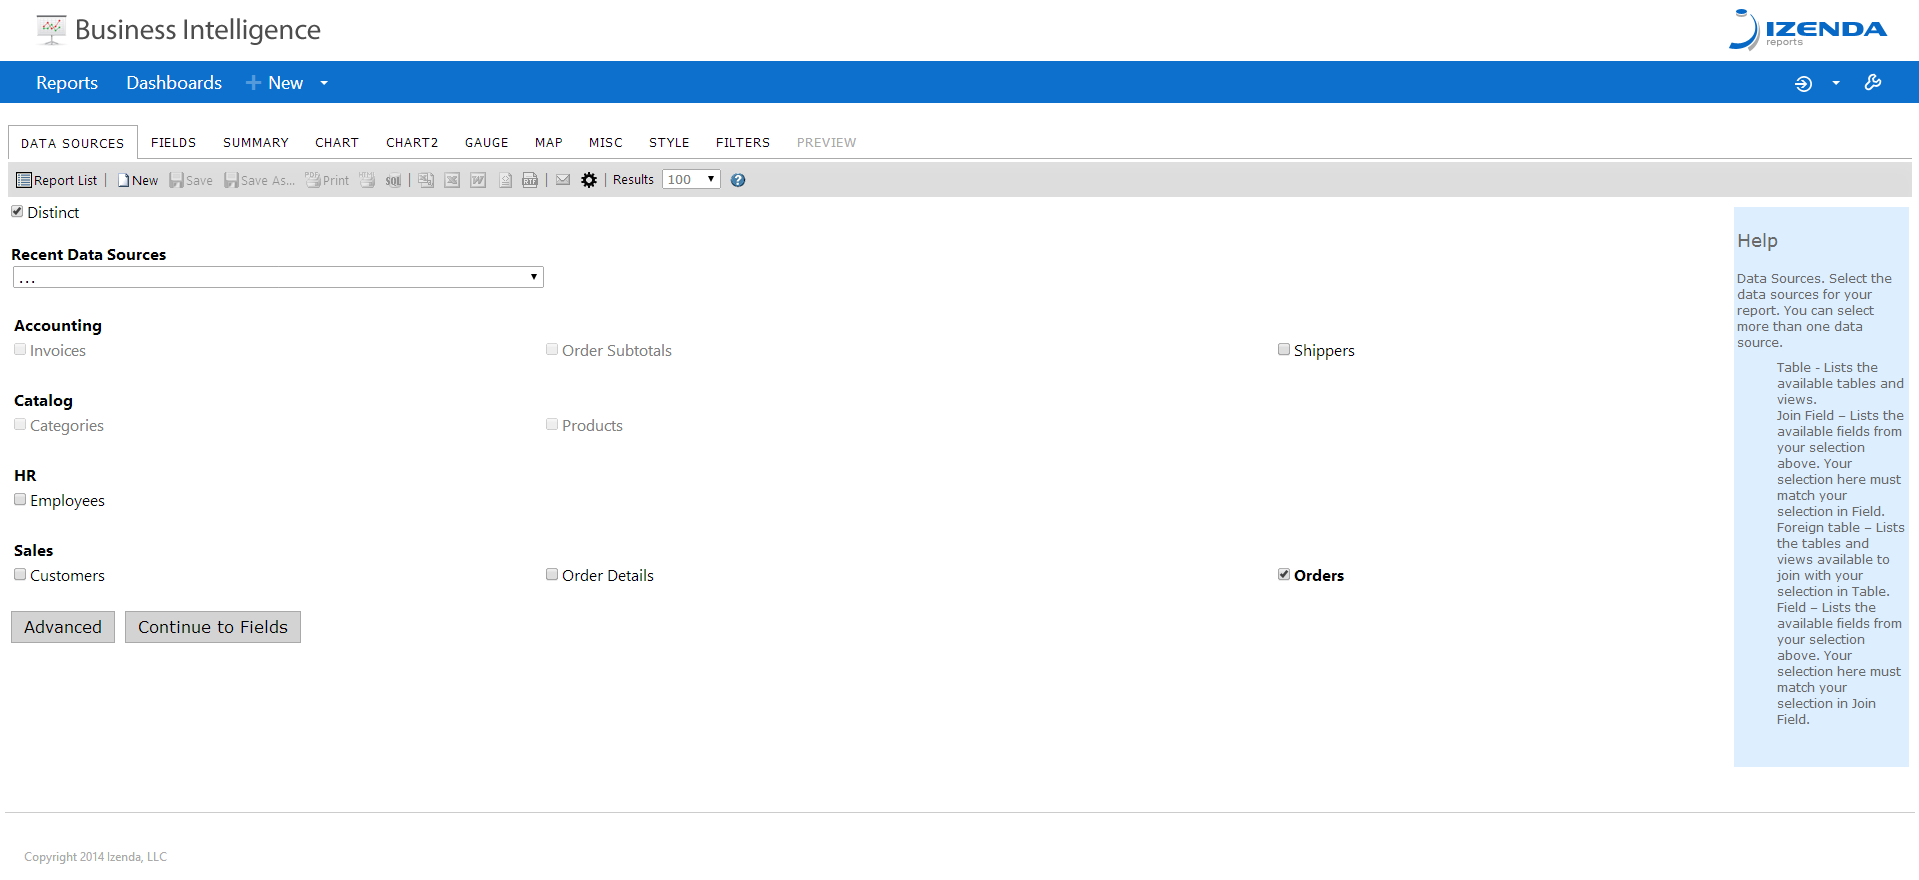 Now that you are on the [[Fields tab|http://wiki.izenda.com/Guides/ReportDesign/4.0-fields-tab]], select the fields **ShipCountry**, **ShipCity**, and **Freight** in the dropdowns on the page. This will add the fields to your report. Notice that when you select a field, a new set of controls appears below to allow additional selections. This and other features are covered more in Section 3, referenced above. 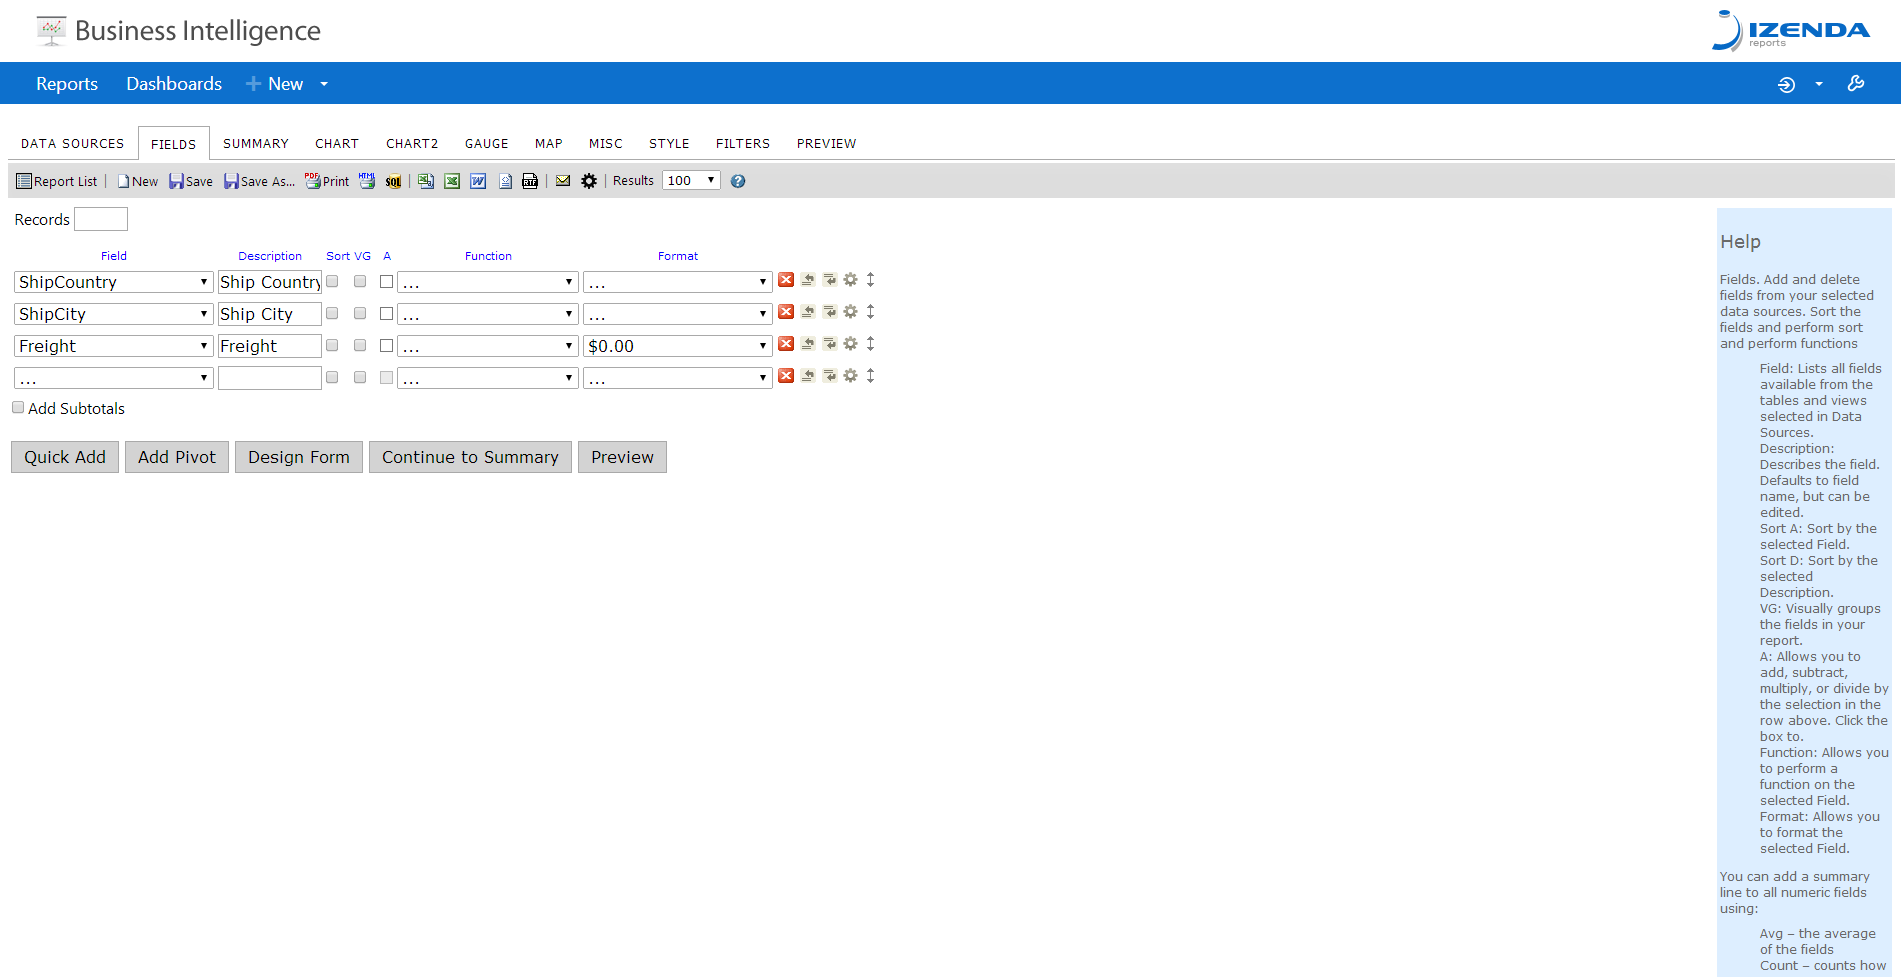 You're almost done with your first report. You may now click **Preview** to see what your report will look like to anyone who views it. 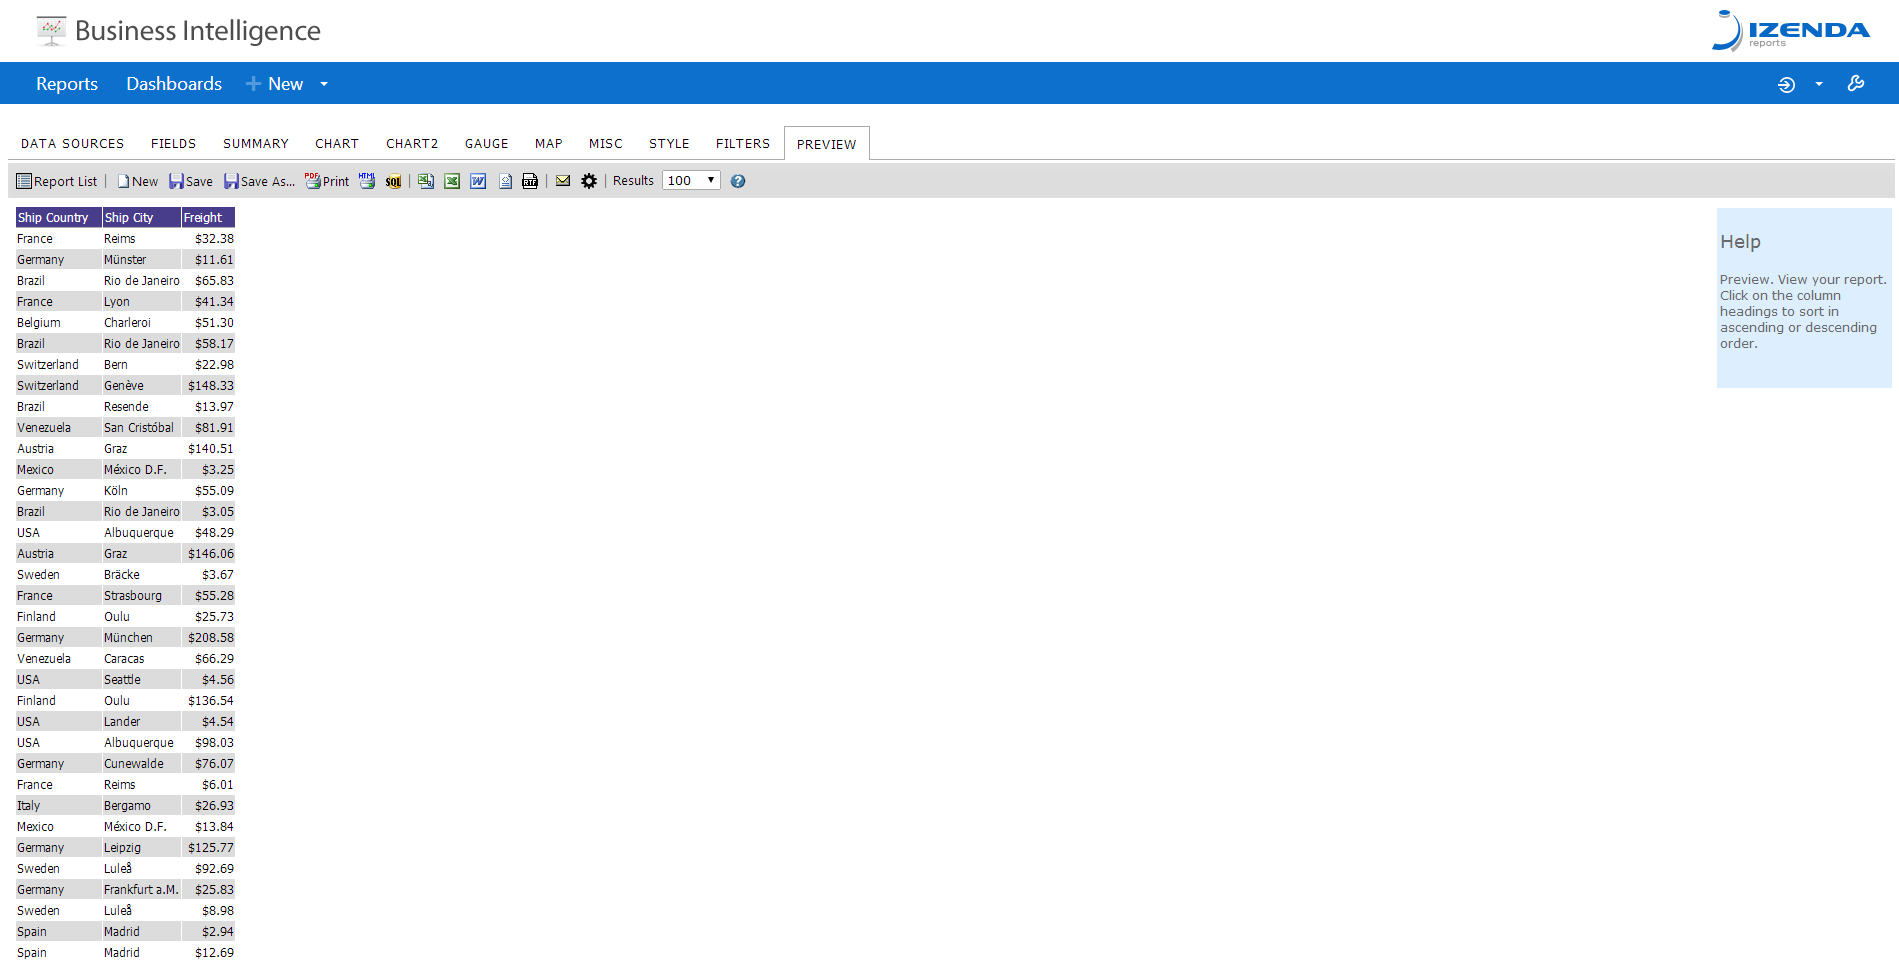 You can now click **Save As...** on the toolbar to save your new report. You must enter a name for your report, but the category is optional. If you opt not to select a category, the report will be **Uncategorized**. 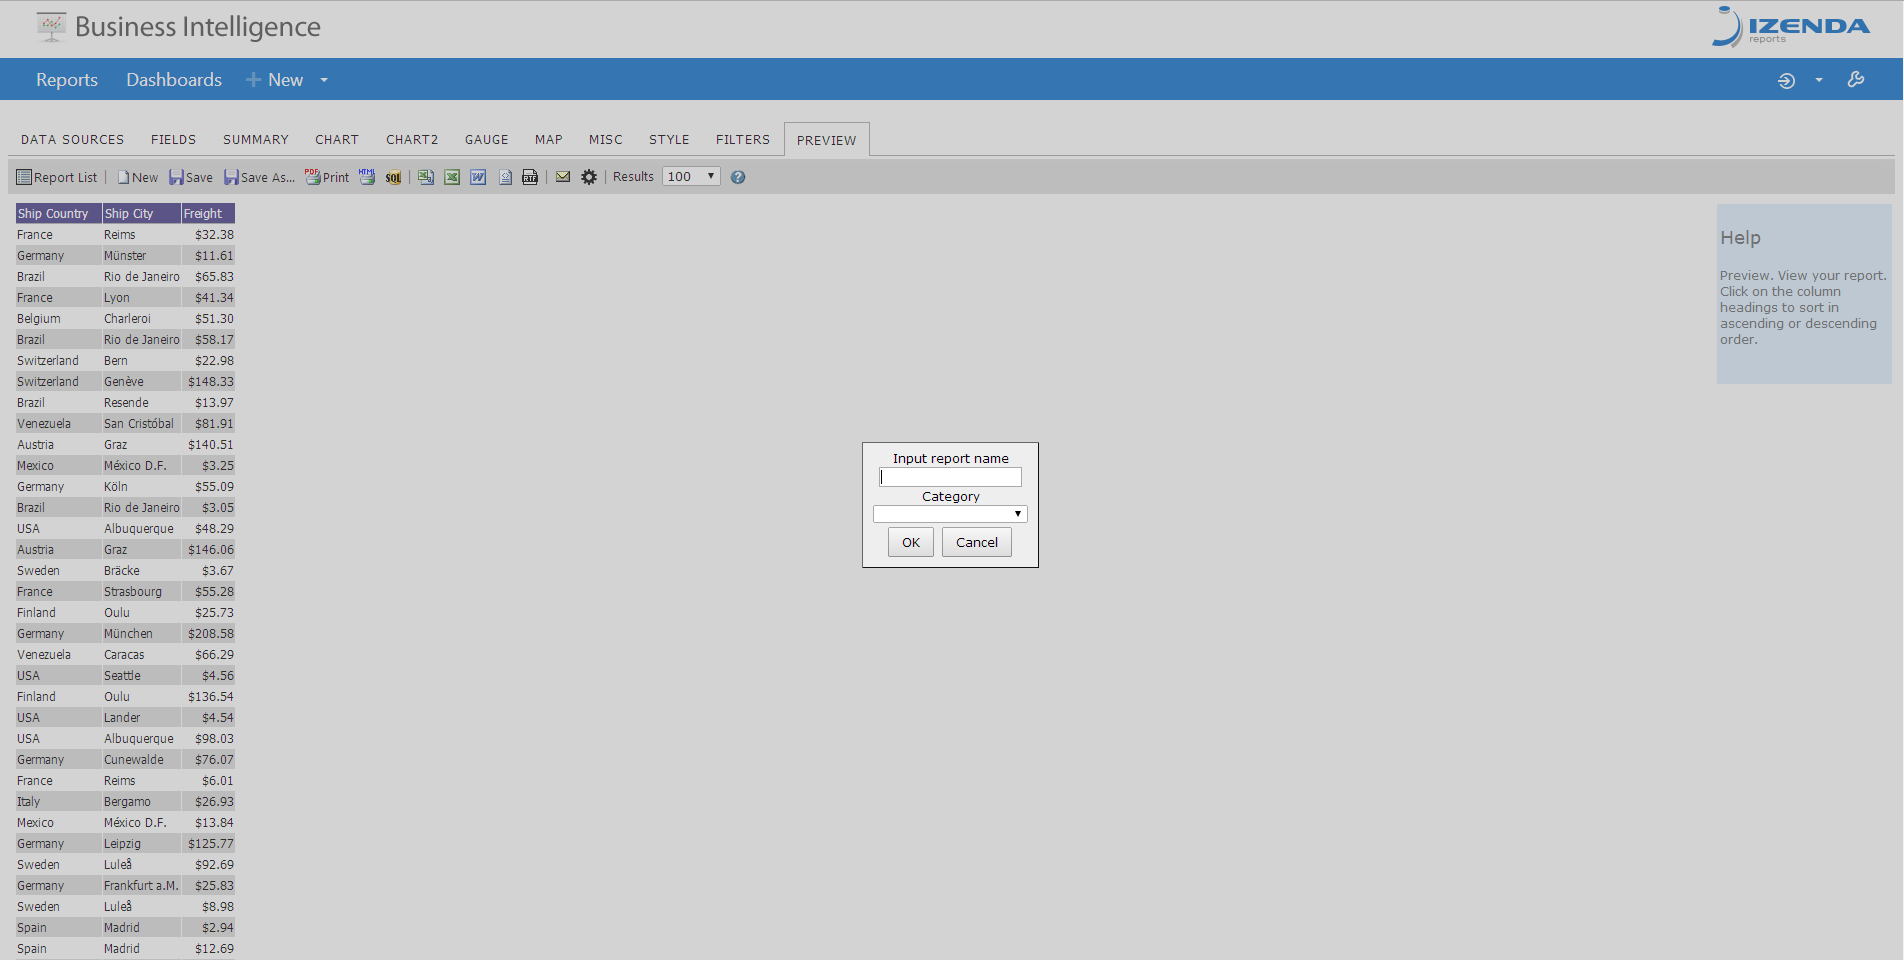 You now have your first functional report. This is a very basic example, and Izenda Reports offers many more capabilities, described throughout this guide. ##2.2 The Report Designer toolbar While saving your report, you may have noticed there are many other options there besides just saving the report. You can find out more about the toolbar buttons on the Report Designer by [[reading this article|http://wiki.izenda.com/Guides/ReportDesign/3.0-Data-sources-tab]]. There are options to save reports, create new reports, print reports, email reports, and navigate to other sections of the reporting application. ##2.3 Report Design Lessons ###2.3.1 Designing a List of Shipping Countries Report _**Goal**_ - The goal of this lesson is to: * Create a report that lists all of the countries the company ships to * View the report by using the preview tab * Name the report * Save the report 1. From the ReportList.aspx page Click on **Design a New Report**. 2. Under the **Data Sources tab** - Click on the drop down arrow and choose **Orders** 3. Under the **Fields tab** - Click on the drop down arrow and choose **ShipCountry**. Leave the **Description** box as it is. (this will be discussed in another lesson). 4. Click on the **Preview tab** to see the Izenda report you just created. 5. Click on **Save as** tool bar button, name your report, for example **Lesson 1-1**, and enter the category you want the report to be shown under, for example **Training**, click OK. Now you have a saved Izenda report. _**Note:** This Izenda report shows you real time information. If you want to take a snap shot of the current results you can export the information. (Exporting will be discussed later)_ 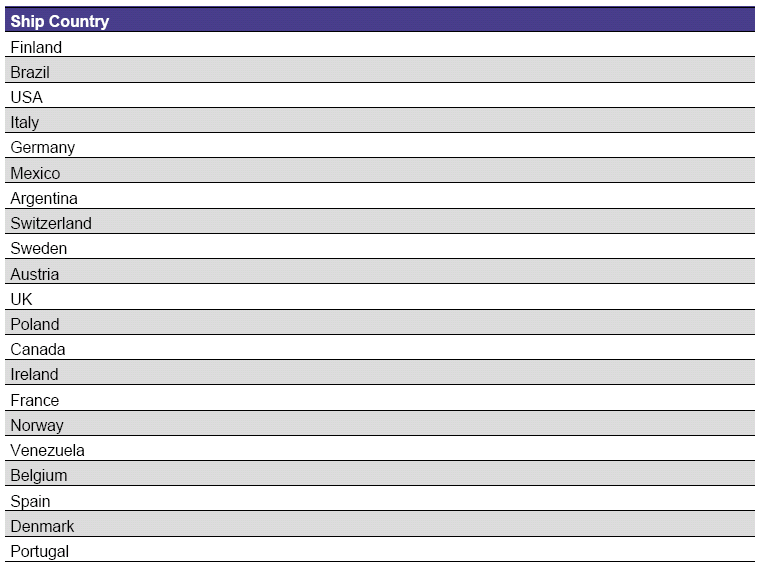 ###2.3.2 Adding additional fields, using field functions, using field formats, & sorting the data _**Goal**_ - The goal of the lesson is to: * Add to the country list report from the previous lesson * Include ShipCity * Include the number of orders * Include the total freight costs * Sort the data alphabetically by country 1. If you do not have the lesson open from before, then you will need to load it by clicking the link above. 2. Let's add some more information to the report other than just the **ShipCountry** field. Click the **fields tab**. 3. In the bottom most row under the field label, select **ShipCity** from the drop down box. Add **Order ID** & **Freight** as well. 4. The freight field is a dollar amount so select the **$0.00** Format from the drop down box. 5. Click Preview. You will see the fields have been added. 6. I'm interested in the number of orders to each city and the total freight spent shipping the orders. To see this information we need to add some functions to the fields. 7. Next to the **OrderID** field select **count** from the function drop down box. This will count the number of order IDs from the previous report. Let's change the description to **Orders** by entering that into the description textbox. 8. **Notice that when a function is selected all of the fields default to using the group function. 9. Next to the **Freight** field select **sum** from the function drop down box. This will sum the freight. Let's change the description to **Freight** by entering that into the description textbox. 10. Click the **Preview** tab. Now let's sort the data alphabetically by country. 11. Click on the **Fields tab**. Then click on the **sort a-z** checkbox on the same row as the **ShipCountry** field. 12. Click the **Preview tab**. Now the data is sorted. Let's save the report. 13. Click on the **Save as** tool bar button, name your report, for example **Orders and Freight by Country**, and enter the category you want the report to be shown under, for example **Training**, click ok. Now you have a saved Izenda report. **Screenshot of the final report made in this lesson** 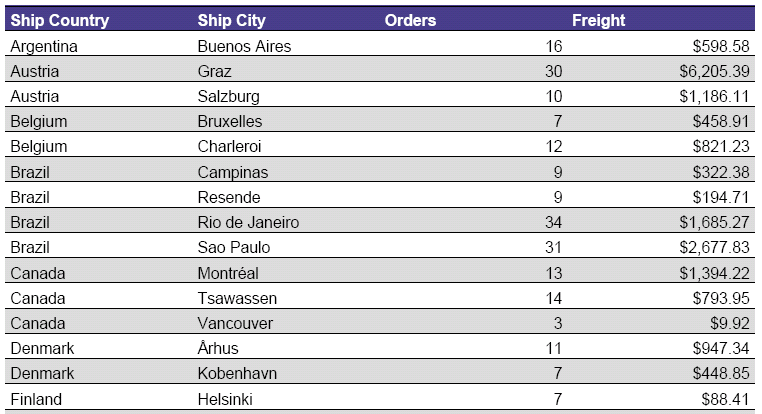 ###2.3.3 Visually Grouping & Subtotal Function _**Goal**_ - The goal of this lesson is to: * Demonstrate the power of the Visual Grouping function * Add a and subtotal function 1. If you do not have the lesson open from before, then you will need to load it by clicking the link above. 2. Notice how some countries have multiple cities listed. We can visually group by the country and have a cleaner report. Click on the **Fields tab**. 3. Click the **VG** check box in the **ShipCountry** field row. Note: When using VG it must be the first field in the fields tab. If the field you select to Visually group by is not the first field then use the up arrow icons to make it the first field. 4. Click the **Preview tab**. Now the data is sorted by the Ship Country. Let's add subtotals for each Ship Country. 5. Click the **Fields tab**. 6. Select **Sum** from the **subtotal** dropdown box. 7. Click the **Preview tab**. Subtotals have been added. Let's save the report. 8. Click on the **Save as** tool bar button, name your report, for example **Orders and Freight Totals by Country**, and enter the category you want the report to be shown under, for example **Training**, click OK. The Izenda report is saved. **Screenshot from the final report made in this lesson** 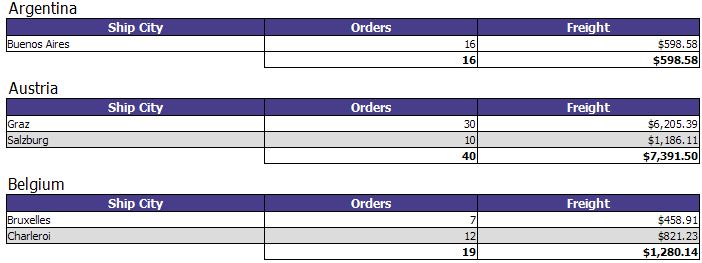 ###2.3.4 Adding a Summary and a Title _**Goal**_ - The goal of this lesson is to: * Add a summary grid to the report * Add a title to the report 1. If you do not have the lesson open from before, then you will need to load it by clicking the link above. 2. There is a lot of data here so let's add a summary. Click the **Summary** tab. 3. Under the **Fields** dropdown - Click on the drop down arrow and choose **ShipCountry**, as well as **Order ID** and **Freight**. 4. For the **Ship Country** field select the **group** function and select the **sort a-z** checkbox. This will group the data together by country and sort the data alphabetically. 5. For the **Order ID** field select the **count** function and change the description to say **Orders**. This will count the number of Order IDs for the country. 6. For the **Freight** field select the **Sum** function and the **$0.00** format. Change the description to say **Freight**. This will sum the freight for all orders sent to each country. 7. Let's add a grand total to see how much business we have done. Check Add Sub-totals. 8. Click the **Preview tab**. You will have to scroll down to the bottom to see the report. 9. Let's move the summary to the bottom of the report. Click on the **Style** tab. 10. Scroll down until you see the report order. Click on the down arrow next to **Summary** until it is below **Details**. Now it will be at the bottom of this report. Let's also add a title. 11. Click on the **Misc tab**. In the **Title** box enter **Orders and Freight By City and Country**. 12. Click the **Preview tab**. Now the Report is Titled and in the order I want. Let's Save it. 13. Click on the **Save as** tool bar button, name your report, for example **Lesson 1-4**, and enter the category you want the report to be shown under, for example **Training**, click OK. 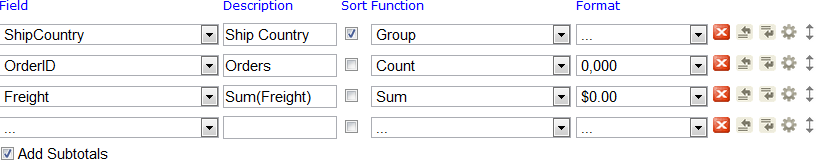 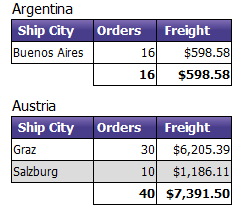 ###2.3.5 Exporting a Report _**Goal**_ - The goal of this lesson is to: * Export the report to Excel _**Note:** To retain this information as it shows on your current Izenda Report let's export the information to Excel. Remember to capture the information showing on a current Izenda report you must download the report. Otherwise the report can change each time you open the report since it reads the data in real time from your data base._ 1. If you do not have the lesson open from before, then you will need to load it by clicking the link above. 2. Click on the **Excel** button on the tool bar. 3. You will see a box that asks **Do you want to open or save this file**. 4. Click **Open**. 5. Now you will see a **web** version of the report. If you get a dialog box that states the file could be harmful to your computer, you can ignore it. Izenda reports will never harm your computer. 6. Click file, save as. 7. Decide where you want to save the file and name the file. 8. Change the **Save as type** to Microsoft Excel Worksheet. 9. You now have an Excel document that shows the information from your report.
Uploading file...
Header
 **This documentation is for the legacy Izenda 6 product. Documentation for the new Izenda 7 product can be found at [[https://www.izenda.com/docs/|https://www.izenda.com/docs/]]**
Sidebar
 --- * [[Izenda 7 Series Documentation|https://www.izenda.com/docs/]] * [[Release Notes]] * [[Upgrade Best Practices|FAQ/Izenda-Update-Best-Practices]] * [[FAQ]] * [[Tutorials]] * [[The Izenda API|/API/AdHocConfig]] * [[The AdHocSettings class|/API/AdHocSettings]] * [Developer Links and Guides](/Guides/Developer-Links-and-Guides) * [[Known Issues]] --- * <a href="http://www.izenda.com" rel="nofollow" target="_blank">Izenda Website</a> * [Product Video](https://www.youtube.com/watch?v=X3-yWFq0w5A) * <a href="http://www.izenda.com/blog" rel="nofollow" target="_blank">Izenda Blog</a> * <a href="http://www.izenda.com/company/" rel="nofollow" target="_blank">About Us</a> * <a href="http://www.izenda.com/contact-us/" rel="nofollow" target="_blank">Contact Us</a> --- * [Guide To Report Design](/Guides/ReportDesign) * [Making Custom Forms Video](http://www.youtube.com/watch?v=5b2axJlgdFs) --- * [[Acknowledgements]]
Edit message:
Cancel