☰
Current Page
Main Menu
Home
Home
Editing 12.0-Pivots-in-Izenda
Edit
Preview
H1
H2
H3
default
Set your preferred keybinding
default
vim
emacs
markdown
Set this page's format to
AsciiDoc
Creole
Markdown
MediaWiki
Org-mode
Plain Text
RDoc
Textile
Rendering unavailable for
BibTeX
Pod
reStructuredText
Help 1
Help 1
Help 1
Help 2
Help 3
Help 4
Help 5
Help 6
Help 7
Help 8
Autosaved text is available. Click the button to restore it.
Restore Text
#12.0 Pivots [[_TOC_]] ##About The Izenda reports Pivot feature allows users to generate analytical data grids from within Izenda reports. The Pivot feature essentially adds extra pivot columns to the right side of the report. This is useful for comparing data over multiple categorical dimensions. Below is an example of the Design and Output of a standard Pivot View of the Average Amount Spent on Freight. 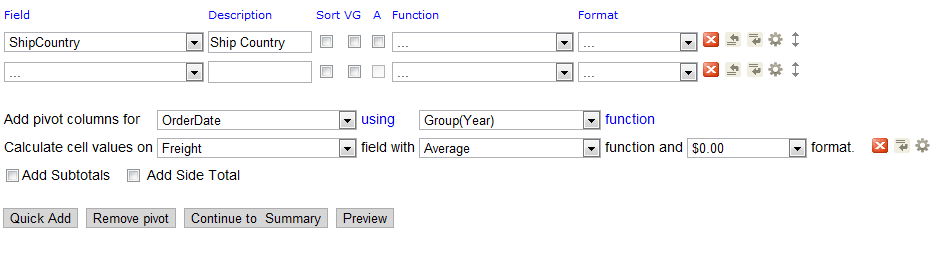 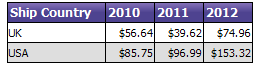 ##12.1 Create a Simple Pivot Report 1. Click on the **Data Sources** tab and select desired data sources. (Ex. Orders) 2. Click on the **Fields** tab. Select the desired Field(s) names & attributes (Sorting, VG, Function, & Format) for the report. (Ex. ShipCountry) Before Pivot: 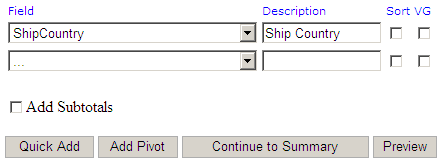 Create pivot view on above report: 1. At the bottom of the **Fields** tab, click the **Add Pivot** button. 2. Select the **Add pivot columns for** dropdown. Select the field you wish to display across the top of the pivot view (Ex. OrderDate). Next, select the function type from drop down (Ex. Group(Year)). This will group the data by the selected function. 3. Select the **Calculate cell values on** dropdown. Select the field you wish to display the calculated result for (Ex. Freight). Next, select the function & format types from the drop downs (ex. Average & $0.00). This field's data will also populate the rows within the pivot view. 4. Optional: Select the "Add subtotals" option to show the sum of each pivot column at the bottom of the report. 5. Click Preview After Pivot:  Essentially, the pivot capability adds additional columns based on the data to the right of the report. In this example, the first column is essentially a standard report and the 2010, 2011, 2012 columns were added by the pivot capability. Standard Report View: 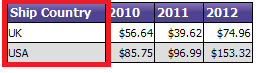 Columns added by Pivot: 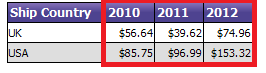 ##12.2 Create an Advanced Pivot Report Let's use these concepts to develop a more sophisticated report that shows us a monthly time-series report for each country visually grouped by employee. In this report, we want to show the Top 5 companies that accounted for the most freight in 2011 and breakdown the analysis by month. Here is what the design screen would look like for this report. 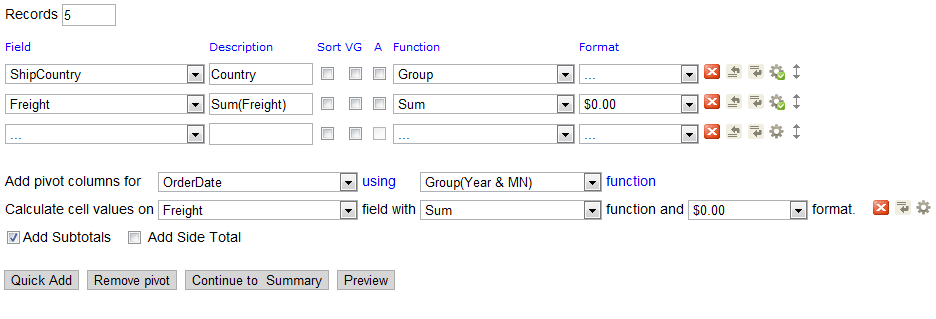 Here's how we add the non-pivot fields. 1. We started off by using the same Data Source for the previous report, Orders. 2. We then Select the Fields, grouping by ShipCountry, and Summing the Freight. 3. Next, we check the Subtotals box to give us a summary line for each country. 4. Then, we click on the advanced icon for the Freight field, sorting from Z-A to list the highest values first. 5. After that, we selected 5 Records in the top left to show the 5 countries with the largest freight amount. For the pivot portion of the report, we: 1. Select the OrderDate at the Pivot column and Year & MN as the way it will be displayed. 2. Select Freight as what we will measure in our pivot, performing a sum for each column. The final step is to add the filter to make it calculate the results from only 2011 data. Finally, here are the results of the report with Pivot:  To make the report more consumable, you might also want to add highlighting to show the months with lows values. For this, click on the [[Advanced Field Settings icon|http://wiki.izenda.com/Guides/ReportDesign/4.0-fields-tab#4.8-Advanced-Field-Settings-Button]] on the pivot field where you are calculating cell values on. Then, set the Cell Highlight to 0 to 50: Red. 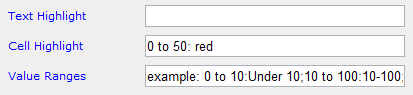 Here is the result: 
Uploading file...
Header
 **This documentation is for the legacy Izenda 6 product. Documentation for the new Izenda 7 product can be found at [[https://www.izenda.com/docs/|https://www.izenda.com/docs/]]**
Sidebar
 --- * [[Izenda 7 Series Documentation|https://www.izenda.com/docs/]] * [[Release Notes]] * [[Upgrade Best Practices|FAQ/Izenda-Update-Best-Practices]] * [[FAQ]] * [[Tutorials]] * [[The Izenda API|/API/AdHocConfig]] * [[The AdHocSettings class|/API/AdHocSettings]] * [Developer Links and Guides](/Guides/Developer-Links-and-Guides) * [[Known Issues]] --- * <a href="http://www.izenda.com" rel="nofollow" target="_blank">Izenda Website</a> * [Product Video](https://www.youtube.com/watch?v=X3-yWFq0w5A) * <a href="http://www.izenda.com/blog" rel="nofollow" target="_blank">Izenda Blog</a> * <a href="http://www.izenda.com/company/" rel="nofollow" target="_blank">About Us</a> * <a href="http://www.izenda.com/contact-us/" rel="nofollow" target="_blank">Contact Us</a> --- * [Guide To Report Design](/Guides/ReportDesign) * [Making Custom Forms Video](http://www.youtube.com/watch?v=5b2axJlgdFs) --- * [[Acknowledgements]]
Edit message:
Cancel