☰
Current Page
Main Menu
Home
Home
Editing Dashboards-v2
Edit
Preview
H1
H2
H3
default
Set your preferred keybinding
default
vim
emacs
markdown
Set this page's format to
AsciiDoc
Creole
Markdown
MediaWiki
Org-mode
Plain Text
RDoc
Textile
Rendering unavailable for
BibTeX
Pod
reStructuredText
Help 1
Help 1
Help 1
Help 2
Help 3
Help 4
Help 5
Help 6
Help 7
Help 8
Autosaved text is available. Click the button to restore it.
Restore Text
[[_TOC_]] #Introduction Izenda now offers its new Angular.js Dashboard Designer / Viewer with the platform’s latest update to 6.9. Once implemented, any existing dashboards will automatically convert to the new dashboard format. While previous versions were limited to a static structure for the dashboard, tiles can now be resized. Users can add new tiles to any point on the grid in the Dashboard Designer. The dashboard displays with more fluid animation as well. The new Dashboard Designer/Viewer also includes a presentation mode, which allows the user to slide through dashboard tiles on a carousel. #Features * New responsive Angular.js Dashboards * User friendly user interface * Modern Look and Feel * Movable and resizable tiles * Presentation Mode to scroll through full screen dashboard tiles #Installation ##Webforms 1. [Download](http://www.izenda.com/update-your-izenda-version/) the full Webforms kit and replace the bin and resources folders within your projectt 2. Take the Dash.aspx and Dash.aspx.cs files from the downloaded kit and copy it to your project 3. Update Default.Master with the new changes to update links to Dash.aspx from Dashboards.aspx ```c# <div class="top-nav applyStyles" id="blueHeader"> <div class="page"> <ul id="topnav" style="margin: 0px; padding: 0px;"> <li class="top-nav-item"><a href="ReportList.aspx">Reports</a></li> <li class="top-nav-item"><a href="Dash.aspx?clear=1" onclick="ShowRlToDbLoading();">Dashboards</a></li> ``` 4. In the global, update the dashboard viewer setting to AdHocSettings.DashboardViewer = "Dash.aspx";, as well as the dashboard designer setting to AdHocSettings.DashboardDesignerUrl = "Dash.aspx";. Additionally, set AdHocSettings.DashboardDateSliderMode = DashboardDateSliderMode.None;, this will enable between date filters to be exposed in the new dashboard. Without this setting date filters will not be exposed. ##MVC 1. [Download ](http://www.izenda.com/update-your-izenda-version/)the full MVC kit for 6.9 2. Copy the bin and resources from the kit downloaded into your project 3. Add: _Dashboards-New-Head-Angular, _Dashboards-New-Body-Angular, _SiteLayout and Dash files to Views/Reporting. Ensure they are included in the project 4. Update the IzendaReportingController.cs to include: ```c# public ActionResult Dash() { return View(); } ``` 5. In the global, update the following: AdHocSettings.DashboardViewer = "Dash" and AdHocSettings.DashboardDesignerUrl = "Dash";. Additionally, set AdHocSettings.DashboardDateSliderMode = DashboardDateSliderMode.None;, this will enable between date filters to be exposed in the new dashboard. Without this setting date filters will not be exposed. ### Tips * When upgrading, ensure log4net.dll and log4net.xml are in the Bin folder * If you get an error stating System.Web.Mvc or System.Web.Mvc.Ajax are not in the namespace, right-click the file in the references, click properties and ensure Copy Local is true. #Guide ##Creating a New Dashboard **a)** Click on the arrow to expose the drop down menu under New **b)** Select Dashboard from the Menu drop down. A New Blank Dashboard will be exposed with a blank tile. 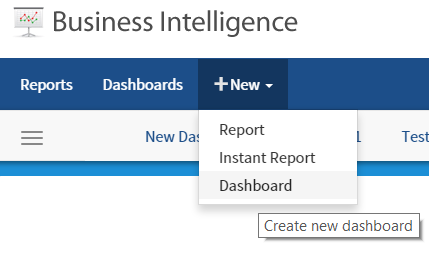 ##Adding Report Parts to the Dashboard Tile **c)** Click on the + sign to add a Report Part to the new Dashboard 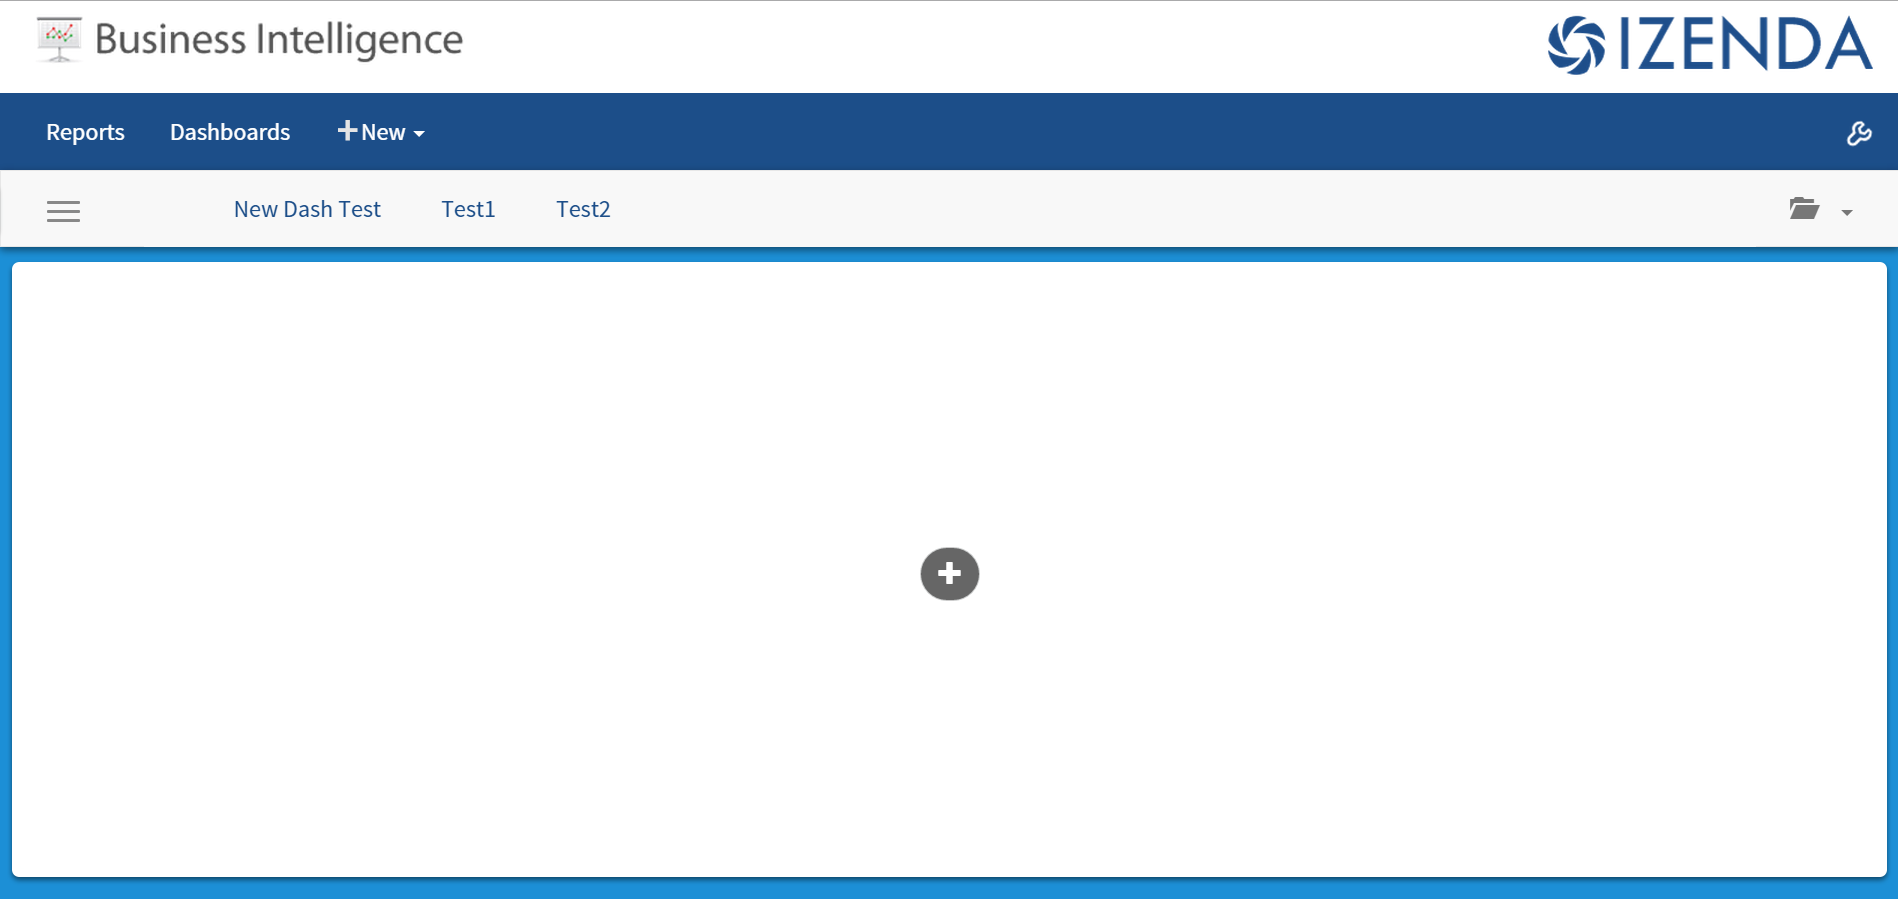 **d)** The user can now select a report to use in the dashboard. 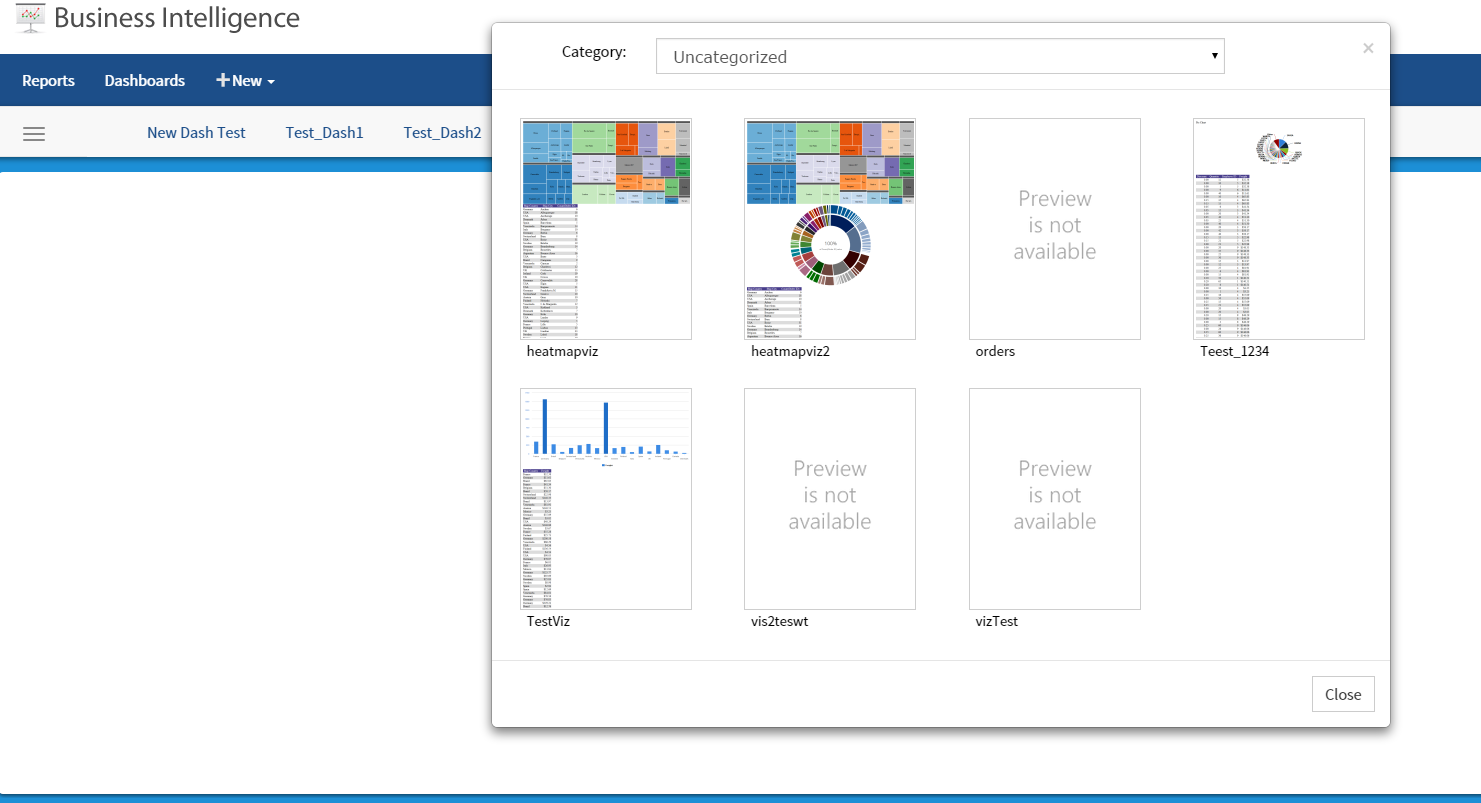 **e)** Once a report is selected, the user is presented with a window displaying all of the report parts as options to add to the new dashboard. These can include charts, maps, gauges, summaries or report details. 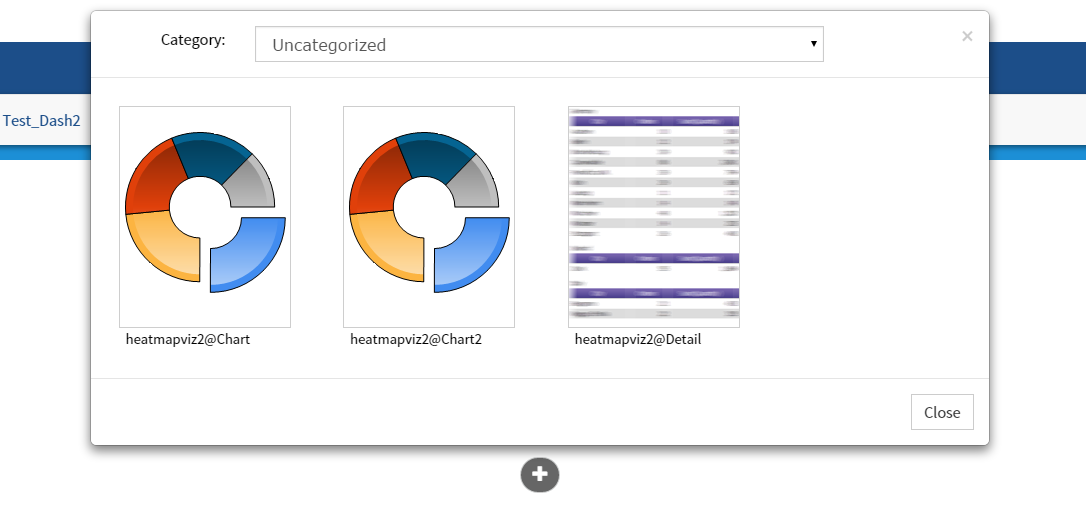 **f)** The report part selected will then be displayed to the user. 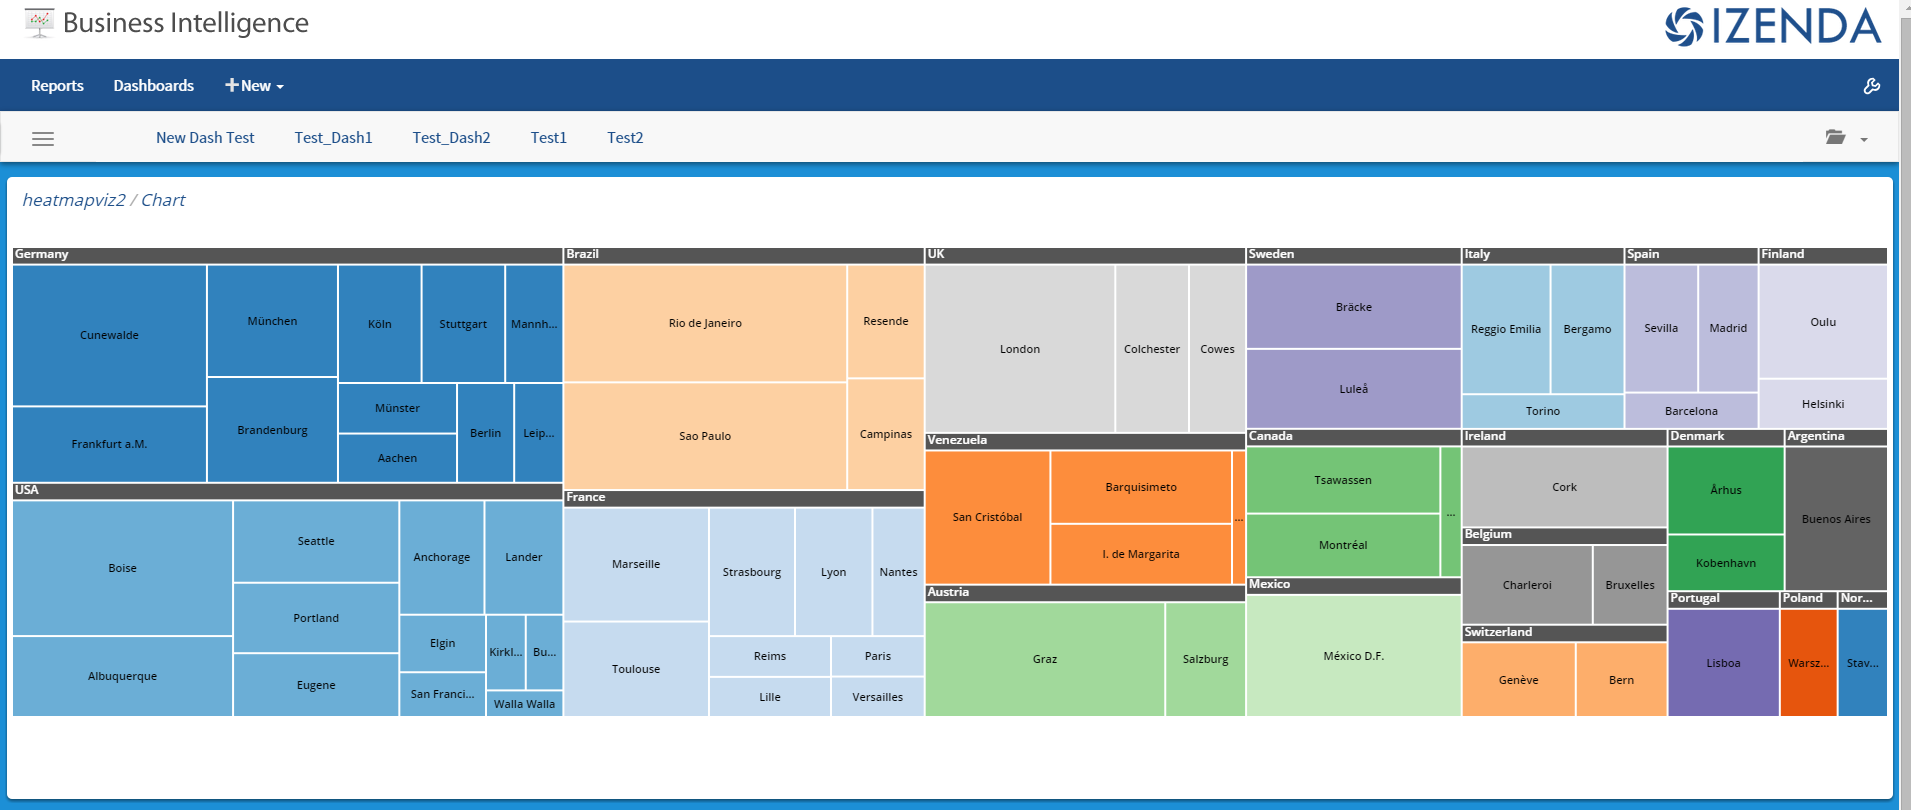 To remove a tile, simply click the “X” in the top right corner of the tile. 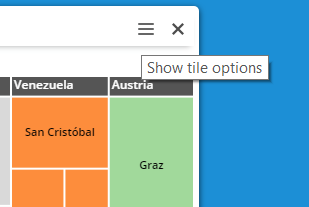 To add additional tiles to the dashboard, the user can click on a blank area of the dashboard background. 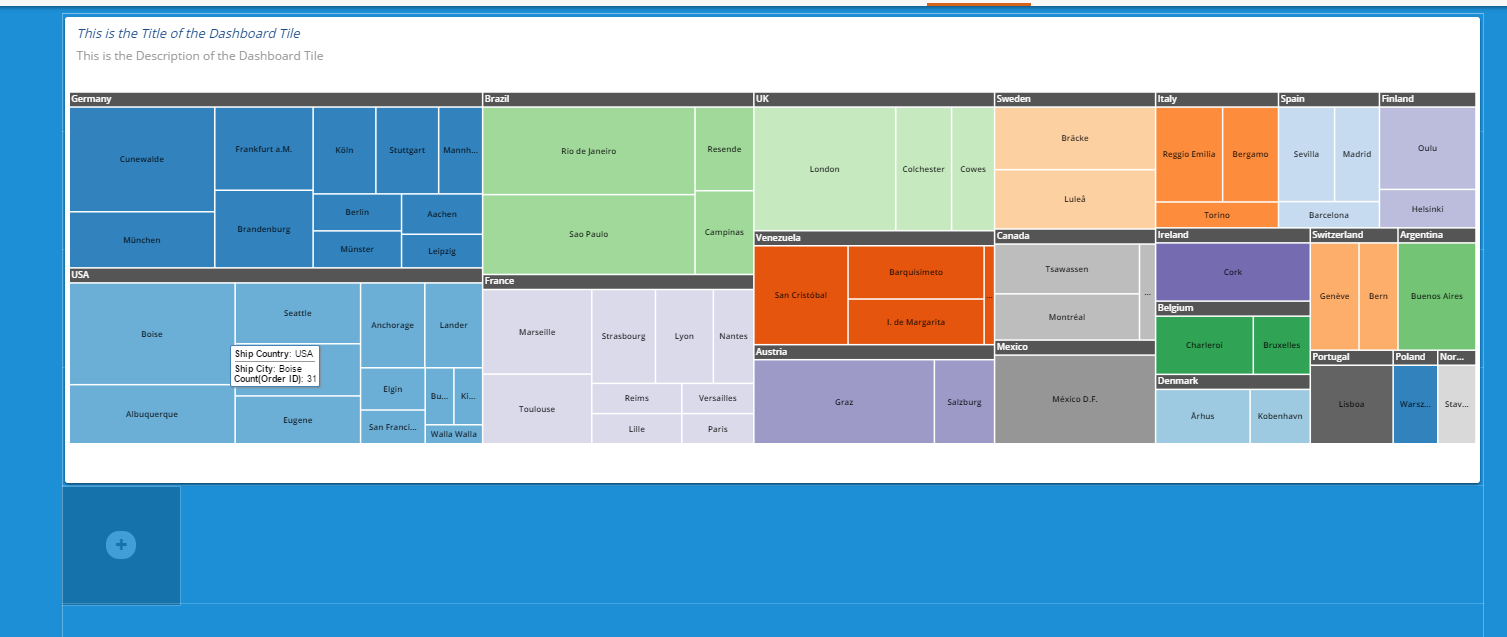 A new blank tile will then be displayed. 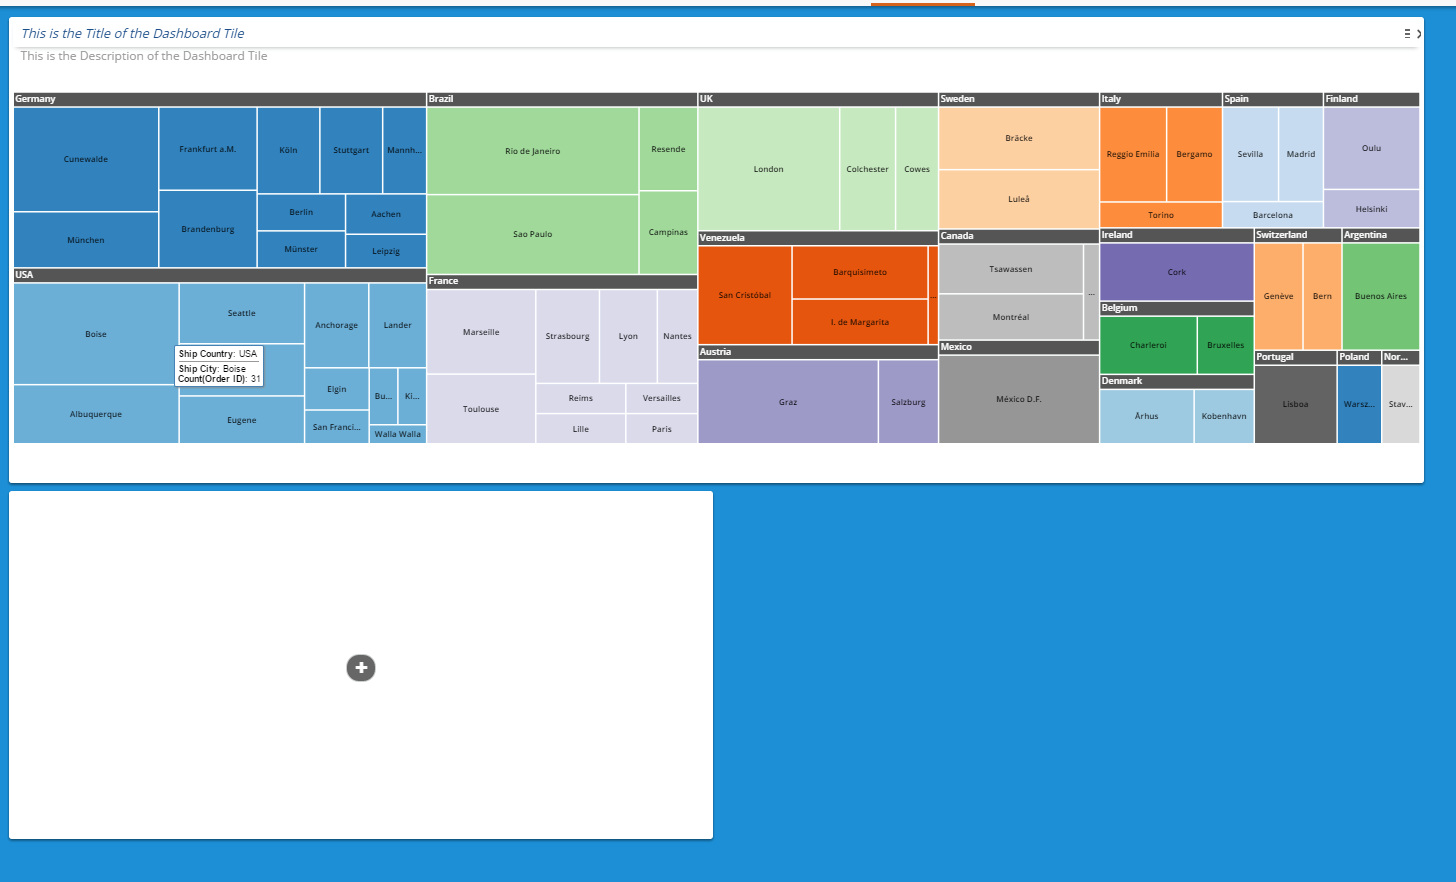 The user can repeat the process to add additional tiles ##Moving & Resizing Dashboard Tiles The tiles can be resized by dragging the corners to the desired length or width. Tiles can also be moved around the Dashboard. When the tile shows a green hue, it is positioned correctly and can placed on the grid. If the tile shows a red hue, it is not positioned on the grid properly and cannot be moved. Properly Positioned Tile for move (green hue) 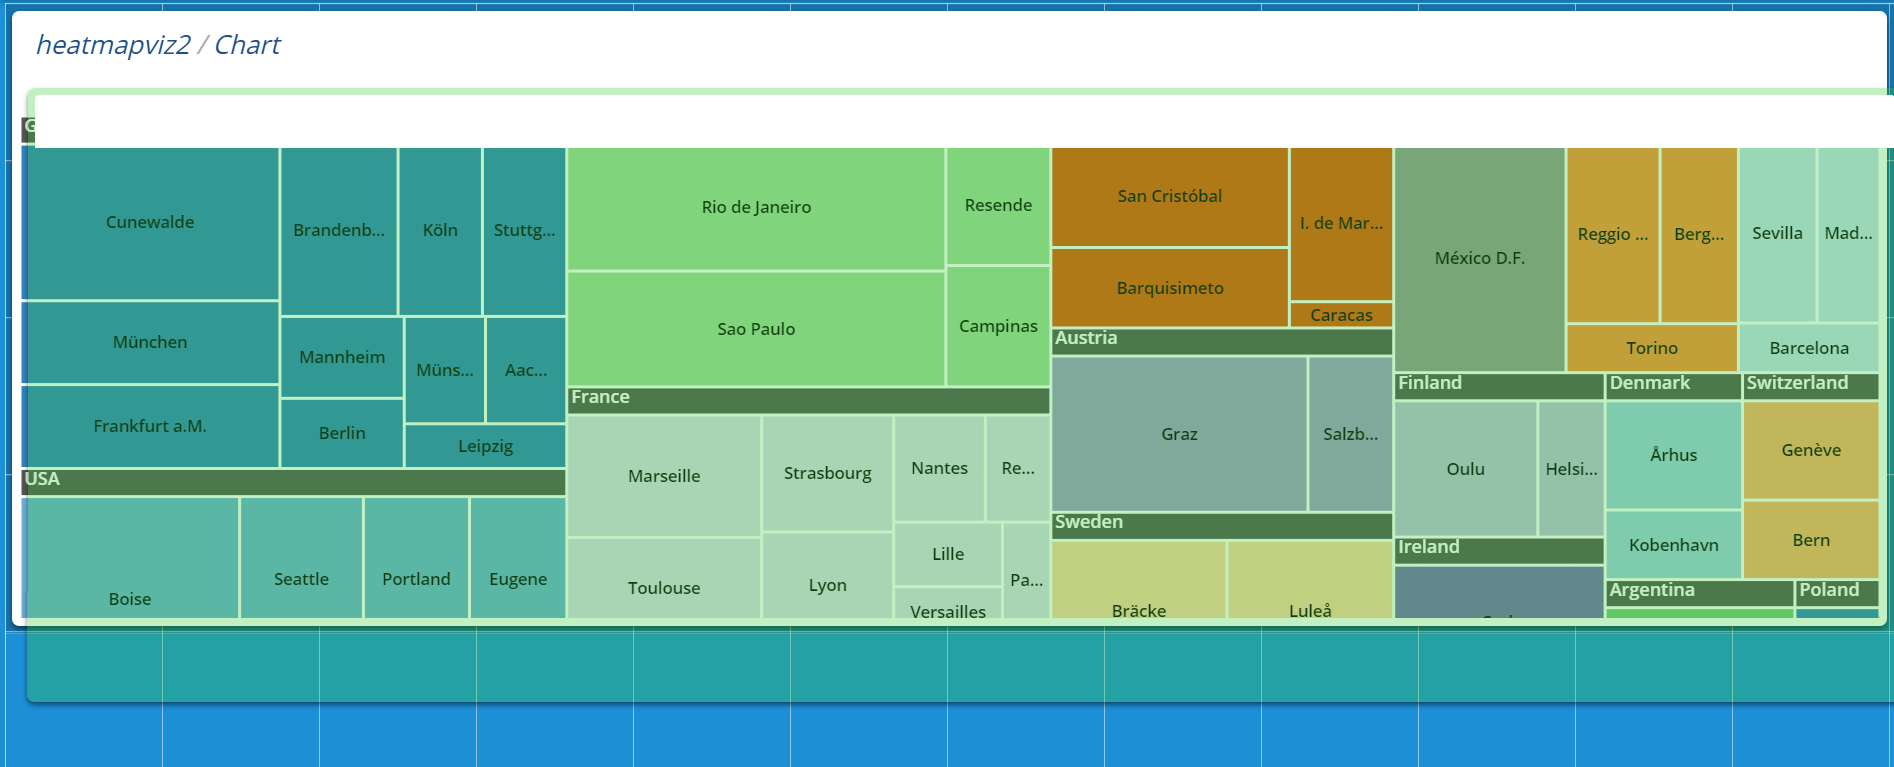 Improperly Placed Tile for move (red hue) 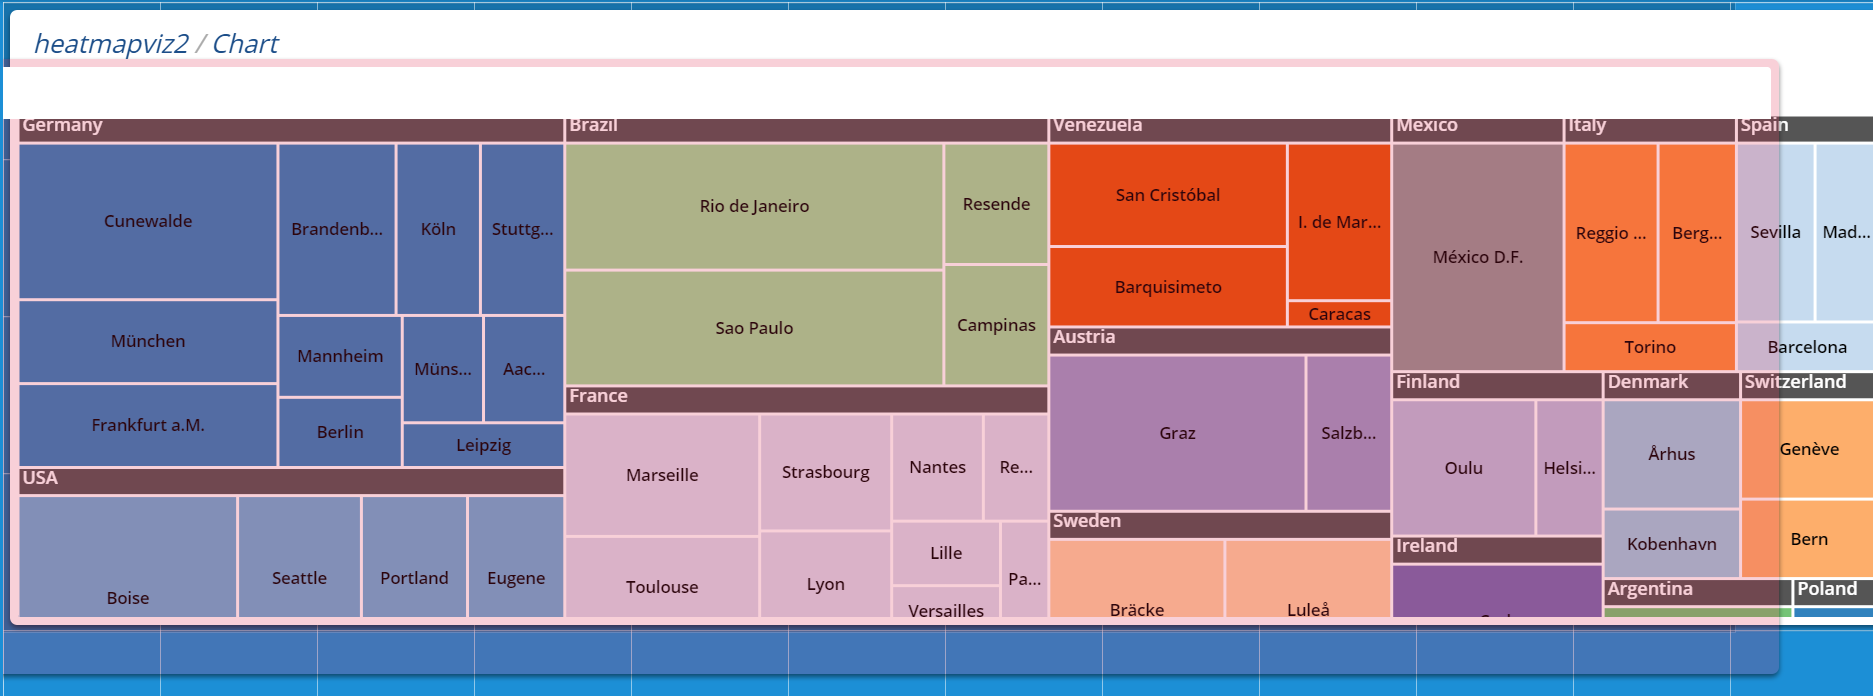 ##Tile Customizations There are several options available for customizing a tile. These options can be found by clicking on the menu button in the top right corner of the specific tile. The tile will then spin to the reverse side, revealing the additional options. 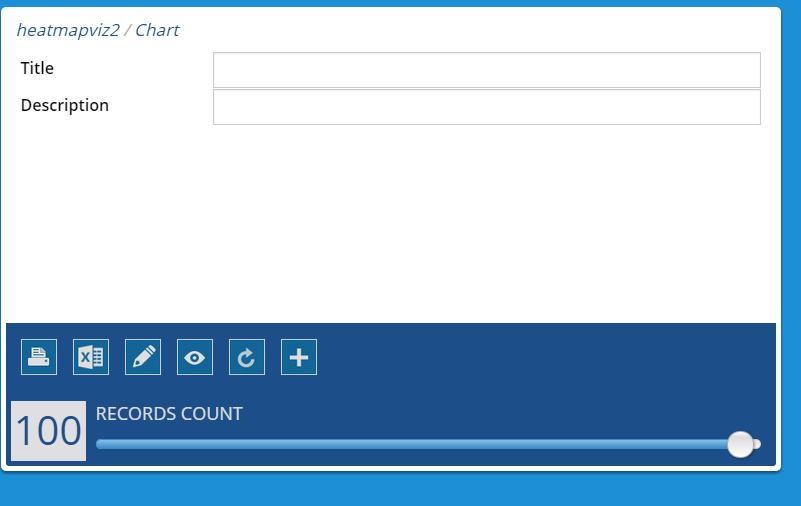 The user can now choose to add a Tile that is displayed on the front of the tile along with a Description that is also displayed on the tile 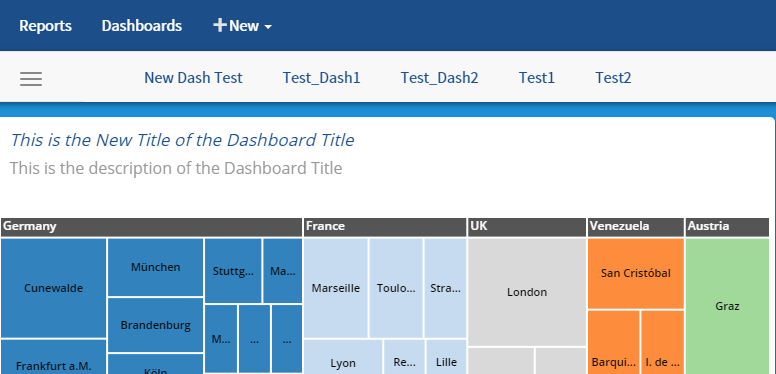 The additional following menu items are available for use on the back of each dashboard tile   |**Appearance**|**Description**| |:------------:|:-------------:| ||Print tile report – prints the tile from dashboard| ||Export tile report to Excel| ||Opens the Report the tile is created from in report editor| ||Opens the Report the tile is created from in the report viewer| ||Reloads the tile from report| ||Add a new report part to tile (change report part selected from original report)| ||Change the Number of Records to be displayed in the tile| ##Viewing an Existing Dashboard Click on Dashboard at the Top Navigation Bar 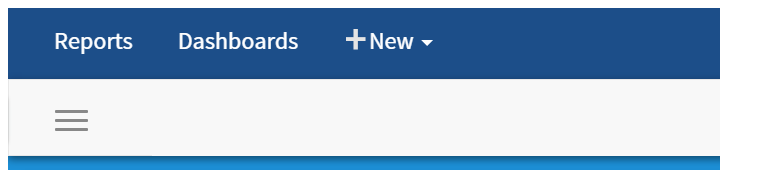 Dashboards will be displayed as tabs in the window with the active window highlighted from below 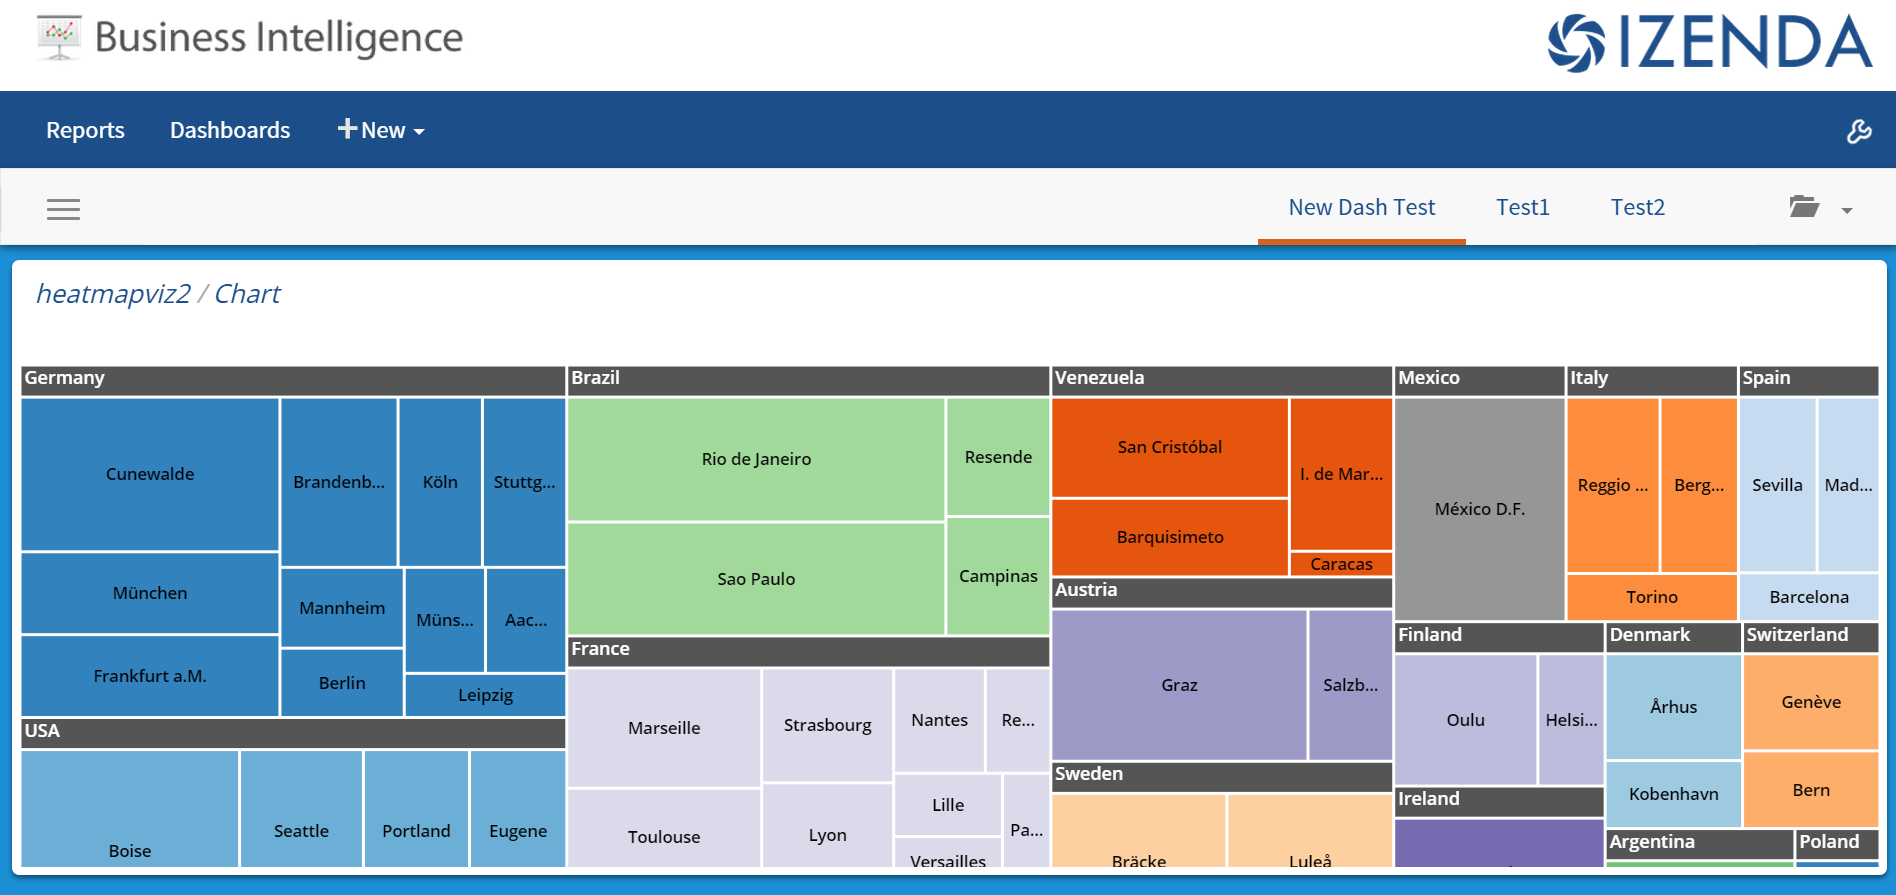 ##Main Dashboard Menu This menu offers the following menu options are available from the menu button in the top left navigation bar when expanded  |**Appearance**|**Description**| |:------------:|:-------------:| ||Collapse Menu| ||Presentation Mode – Allows the user to scroll through the Dashboard tiles in a carousel | ||Create a New Dashboard| ||Refresh Tile Data. This button will refresh _data only_ aspects of the tile, meaning the report query will be rerun with current settings and tile data updated.| ||Refresh Report Metadata. This button will refresh _non-data_ elements of the tile such as style and filter settings.| ||View Filters – Each report in the dashboard must share the same filter to be displayed | ||Share Dashboard with other users| ||Schedule Dashboard - Sends dashboard via email at a scheduled time| ||Print Dashboard = Prints Dashboard HTML or Report PDF | ||Save Dashboard - Saves dashboard as different name or pdf file| ||Change Dashboard - Changes background image|
Uploading file...
Header
 **This documentation is for the legacy Izenda 6 product. Documentation for the new Izenda 7 product can be found at [[https://www.izenda.com/docs/|https://www.izenda.com/docs/]]**
Sidebar
 --- * [[Izenda 7 Series Documentation|https://www.izenda.com/docs/]] * [[Release Notes]] * [[Upgrade Best Practices|FAQ/Izenda-Update-Best-Practices]] * [[FAQ]] * [[Tutorials]] * [[The Izenda API|/API/AdHocConfig]] * [[The AdHocSettings class|/API/AdHocSettings]] * [Developer Links and Guides](/Guides/Developer-Links-and-Guides) * [[Known Issues]] --- * <a href="http://www.izenda.com" rel="nofollow" target="_blank">Izenda Website</a> * [Product Video](https://www.youtube.com/watch?v=X3-yWFq0w5A) * <a href="http://www.izenda.com/blog" rel="nofollow" target="_blank">Izenda Blog</a> * <a href="http://www.izenda.com/company/" rel="nofollow" target="_blank">About Us</a> * <a href="http://www.izenda.com/contact-us/" rel="nofollow" target="_blank">Contact Us</a> --- * [Guide To Report Design](/Guides/ReportDesign) * [Making Custom Forms Video](http://www.youtube.com/watch?v=5b2axJlgdFs) --- * [[Acknowledgements]]
Edit message:
Cancel