☰
Current Page
Main Menu
Home
Home
Editing Customize-Chart-Colors
Edit
Preview
H1
H2
H3
default
Set your preferred keybinding
default
vim
emacs
markdown
Set this page's format to
AsciiDoc
Creole
Markdown
MediaWiki
Org-mode
Plain Text
RDoc
Textile
Rendering unavailable for
BibTeX
Pod
reStructuredText
Help 1
Help 1
Help 1
Help 2
Help 3
Help 4
Help 5
Help 6
Help 7
Help 8
Autosaved text is available. Click the button to restore it.
Restore Text
#Customize Chart Colors [[_TOC_]] #Basic Charts ##Purpose Customizing the chart colors allows you to inject a bit of your own branding, or any other color scheme, into Izenda's reports. ##Example This image depicts a pie chart with custom colors set to Blue, Red, Yellow and Green. 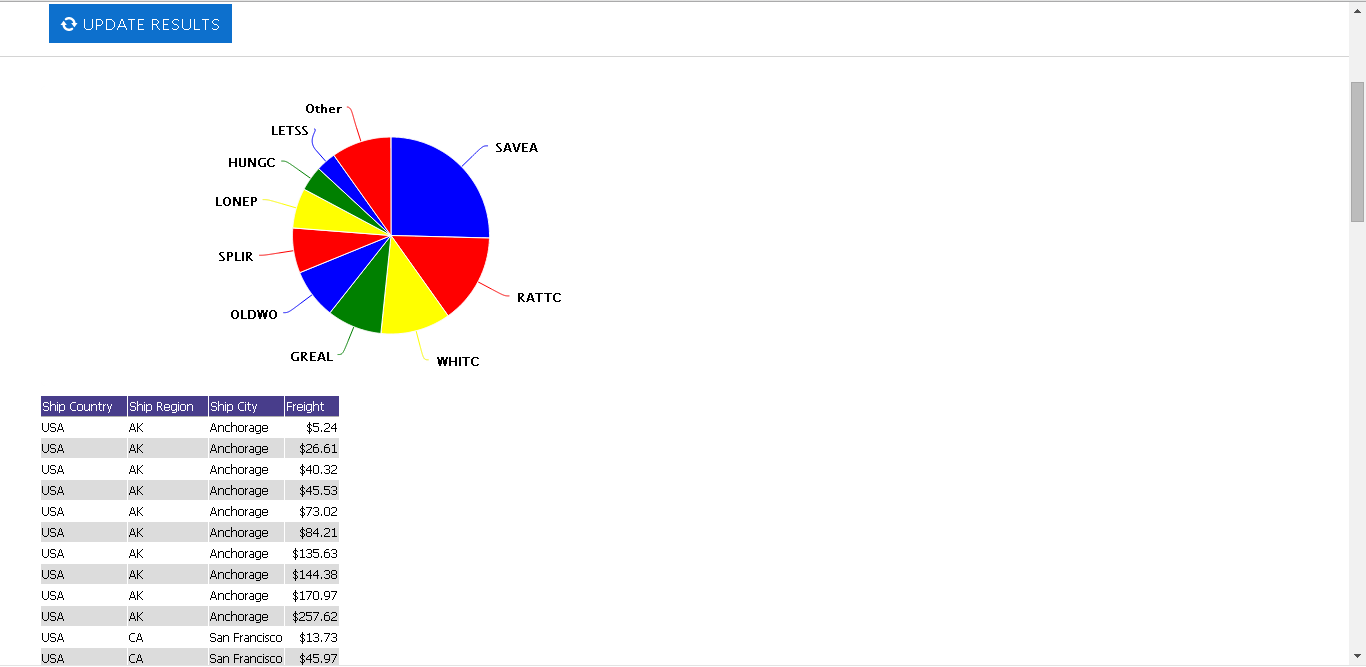 ##Implementation The following code snippet should be added to the default.master page in a webforms implementation, or in Views/Shared/_SiteLayout.cshtml in an MVC implementation: ```html <script type="text/javascript"> htmlChartColors = ['Blue', 'Red', 'Yellow', 'Green']; </script> ``` This would achieve the color scheme from the example image above. *Note:* you will need a recent copy of the Izenda core product. This ability was added in 6.7.0.264, and can be downloaded [[here|http://www.izenda.com/update-your-izenda-version/]] You can also use more complex code: ```csharp public override void CustomizeChart(object chart) { var chartContent = chart.ToString(); int startIndex = chartContent.IndexOf("id='") + 4, endIndex = chartContent.IndexOf("'", startIndex); var chartid = chartContent.Substring(startIndex, endIndex - startIndex); var scriptContent = @" jq$(document).ready(function () { var colors = Highcharts.getOptions().colors; // you can use any colors here (array of colors) window.izenda = (window.izenda || {}); window.izenda.customcolors = (window.izenda.customcolors || {}); window.izenda.customcolors.u = (window.izenda.customcolors.u || {}); window.izenda.customcolors.i = (window.izenda.customcolors.i || 0); function getColorByName(name) { if (!window.izenda.customcolors.u[name]) { window.izenda.customcolors.u[name] = colors[window.izenda.customcolors.i % colors.length]; window.izenda.customcolors.i++; } return window.izenda.customcolors.u[name]; /* // or you can use something like this: if(name == 'Company A') return '#FF0000'; if(name == 'Company B') return '#00FF00'; // ... */ } var chartid = jq$('#" + chartid + @"').data('highchartsChart'); var chart = Highcharts.charts[chartid]; if (jq$(chart.container).is(':visible')) { jq$.each(chart.series, function (i, group) { jq$.each(group.data, function (i, item) { item.color = getColorByName(item.name); item.connector.stroke = item.color; item.connector.element.style.stroke = item.color; }); group.redraw(); }); } });"; System.Text.StringBuilder csb = (System.Text.StringBuilder)chart; csb.Append("<script>" + scriptContent + "</" + "script>"); } ``` #Visualizations Visualizations use the D3 javascript library (http://d3js.org/), which means that to customize the colors used in a specific visualization you must modify that feature's base code. There is no global setting to change the colors used in a visualization, as each visualization has its own independent codebase. ##Example Here, the Heatmap visualization has been customized to use two colors - red and green. 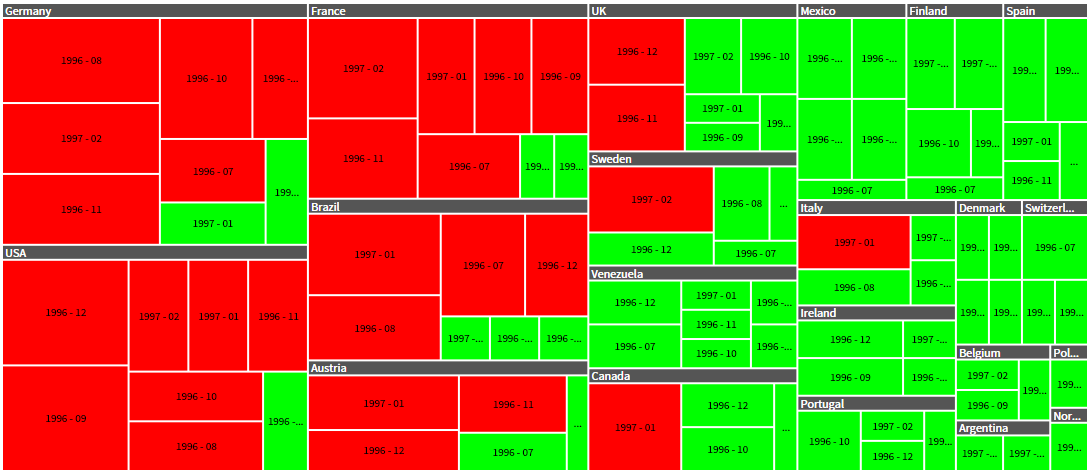 ##Implementation Here we have customized the Color function in the base visualization definition, located by default at .\Resources\Vis\Rectangular\Heatmap\View.html ```javascript var items = vis.getItems(), sum = 0, avg = 0; for (var i = 0; i < items.length; ++i) { sum += vis.unitValue(items[i], s.props.metric); } avg = sum / items.length; function color(d) { // val - value of the current rectangle. var val = vis.unitValue(d, s.props.metric); return (val > avg) ? "#FF0000" : "#00FF00"; } ``` The basic steps involved here are: * Determine the value of each item * Establish an average of all values in the dataset, * Color each value red (#FF0000) if it is above the average, and green (#00FF00) if it is below.
Uploading file...
Header
 **This documentation is for the legacy Izenda 6 product. Documentation for the new Izenda 7 product can be found at [[https://www.izenda.com/docs/|https://www.izenda.com/docs/]]**
Sidebar
 --- * [[Izenda 7 Series Documentation|https://www.izenda.com/docs/]] * [[Release Notes]] * [[Upgrade Best Practices|FAQ/Izenda-Update-Best-Practices]] * [[FAQ]] * [[Tutorials]] * [[The Izenda API|/API/AdHocConfig]] * [[The AdHocSettings class|/API/AdHocSettings]] * [Developer Links and Guides](/Guides/Developer-Links-and-Guides) * [[Known Issues]] --- * <a href="http://www.izenda.com" rel="nofollow" target="_blank">Izenda Website</a> * [Product Video](https://www.youtube.com/watch?v=X3-yWFq0w5A) * <a href="http://www.izenda.com/blog" rel="nofollow" target="_blank">Izenda Blog</a> * <a href="http://www.izenda.com/company/" rel="nofollow" target="_blank">About Us</a> * <a href="http://www.izenda.com/contact-us/" rel="nofollow" target="_blank">Contact Us</a> --- * [Guide To Report Design](/Guides/ReportDesign) * [Making Custom Forms Video](http://www.youtube.com/watch?v=5b2axJlgdFs) --- * [[Acknowledgements]]
Edit message:
Cancel