☰
Current Page
Main Menu
Home
Home
Editing advanced-field-settings
Edit
Preview
H1
H2
H3
default
Set your preferred keybinding
default
vim
emacs
markdown
Set this page's format to
AsciiDoc
Creole
Markdown
MediaWiki
Org-mode
Plain Text
RDoc
Textile
Rendering unavailable for
BibTeX
Pod
reStructuredText
Help 1
Help 1
Help 1
Help 2
Help 3
Help 4
Help 5
Help 6
Help 7
Help 8
Autosaved text is available. Click the button to restore it.
Restore Text
#Advanced Field Settings [[_TOC_]] ##Introduction Advanced field settings provide more granular control over what data is displayed in your report. They can be accessed by clicking on the gear icon to the right of any row on the [[fields tab|/Guides/ReportDesign/4.0-fields-tab]] or the [[summary tab|/Guides/ReportDesign/6.0-Summary-Tab]] in the report designer. There are a number of options that can be selected here. ##Advanced Settings 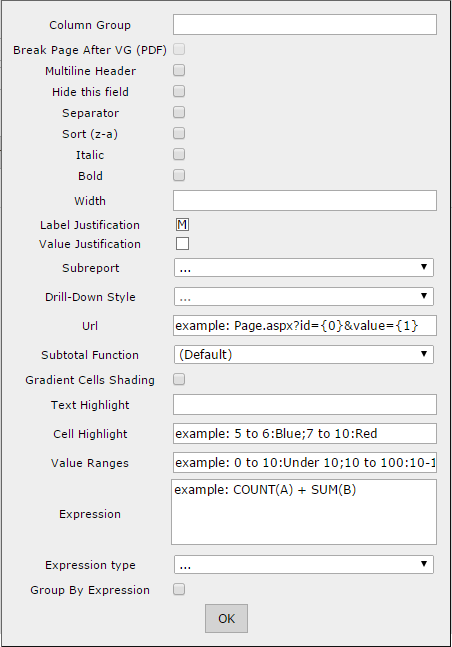 |**Setting Name**|**Description**| |:--------------:|:-------------:| |Column Group|Applies a label to this column that can work over multiple consecutive columns. Any other column that shares the same label will be included in the grouping. <br> 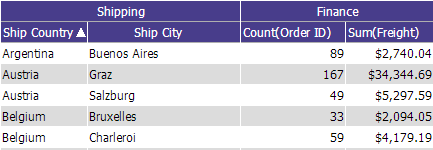| |Page Break After Field|If 'Page Break After Field' box is checked and this field is also a visual group, then it will trigger a page break in a printed report every time this field has different value.| |Multiline Header|'Multiline Header' allows a header to be multi-lined if the length of the header is longer than set width of the column. Each space between words works as a line breaker| |Hide this field|Hides the field from display when report the is ran. Useful for using expressions on multiple fields but when only one of the fields should be displayed.| |Separator|Breaks out Analysis Grid by this field. Functions identically to VG in a normal table. Since VG is used to define the hierarchy of the Analysis Grid, Separator should be used to visually group the Analysis Grid.| |Sort (z-a)|Sorts in descending order| |Italic|Sets whether the column is shown in italics| |Bold|Sets whether the column is shown in bold| |Width|Set the width of the column in number of pixels| |Label Justication|Sets the Column label to the left, right, or middle of the row| |Value Justication|Sets the Value of the field to the left, right, or middle of the row| |Subreport|Sets the drill-down child report. The list contains only reports that have a [[drill-down key|http://wiki.izenda.com/Guides/ReportDesign/9.0-Misc-Tab#9.2.2-Setting-the-drill-down-key]] set for them.<br>_**Note:** The "Automatic" option will attempt to choose a sub-report by matching the drill-down key to the selected field and cannot discern between two sub-reports that use the same drill-down key._| |Drill-Down Style|**Link** – opens in same browser window <br>**Link (New Window)** – opens in new browser window<br>**Embedded** – embeds the drill-down results into the main report<br>**Popup** – opens the results on a pop-up screen<br>**Hover** - Shows the sub-report when you hover the mouse over the item that the sub-report is linked to<br>**ComboKey** - Used in combination with one of the above. When this setting is chosen for the second drilldown key, the value of both fields will be passed from the main report to the sub-report.<br>**Header Link** - Used in a pivot to pass the value of the header (a value derived from the grouping of the pivot header column) to a subreport. Additional values from the left side of the pivot can be passed using ComboKey, or can be incorporated and hidden into the pivot itself.<br> [[Click here for more information.|http://wiki.izenda.com/FAQ/Questions/sub-reports-and-drilldowns]]| |Url|Allows you to define a custom Url to redirect to when the value in this cell is clicked. [You can set whether this url opens in the current tab or a new tab.](http://wiki.izenda.com/API/CodeSamples/OpenCustomUrlInNewWindow)| |SubTotal Function|Sets a customized function for subtotals displayed with this field. The default value is "Sum". This only applies to the bottom sub-totals and not the side sub-totals. If set to 'Expression' then a box will appear allowing you to set an expression for the subtotal. This functions in the same fashion as the typical expression box.| |Gradient Cells Shading|Sets whether cells will use a gradient or solid colors for shading. The larger the value in the cell is, the darker the shading will become. This gradient is determined by establishing a range of x to y, where x is the lowest value in the column and y is the highest, and shading them proportionally where x will be the lightest shade and y the darkest.| |Text Highlight|Highlights the text for a given range. You can refer to the [[Styles tab|http://wiki.izenda.com/Guides/ReportDesign/10.0-Style-tab]] for a list of valid colors or using an RGB hex code such as #ff0033. Syntax is given in the format a to b:color;c to d:othercolor:e to f;anothercolor and so on. For example: "5 to 6:Blue;7 to 10:Red". A colon is used to separate the range and value, semicolons are used to separate pairs of range:value arguments. A value given without a range after the first range:value pair acts as a conditional, for example: "1 to 10:Red;Blue" would color values between 1 to 10 red, and everything else blue. A range may be a single value. You may also use percentages to establish a range, such as 0% to 20%:Red.**NOTE:** It is easy to end your statement with a semicolon like this: "1 to 10:Red;11 to 20:Blue;" This will throw an index error!| |Cell Highlight|Highlights the entire cell for a given range. This follows the same rules as text highlight. You can use both cell and text highlight at the same time to provide contrasting colors, for example if you change the cell to a dark color you might change the text in that cell to a lighter color.| |Value Ranges|Lets you set text values for number ranges. (i.e. setting this to 0 to 10:Under will display the text "Under" when it encounters a value between 0 and 10 for that column). This follows the same rules as text highlight.| |Expression|Allows you to define a customized mathematical or SQL expression to show as the value for the column cells. See more about [[Expressions|http://wiki.izenda.com/Guides/ReportDesign/15.0-Expressions-in-Izenda]]| |Expression Type|Allows you to specify the data type of this field. This is most useful when you are generating output with an expression and need to specify a data type.| |Group By Expression|If checked, this field will be included in the group by statement of the query. This is functionally the same as the Group function, except applicable to expression output within a field rather than to the field itself.|
Uploading file...
Header
 **This documentation is for the legacy Izenda 6 product. Documentation for the new Izenda 7 product can be found at [[https://www.izenda.com/docs/|https://www.izenda.com/docs/]]**
Sidebar
 --- * [[Izenda 7 Series Documentation|https://www.izenda.com/docs/]] * [[Release Notes]] * [[Upgrade Best Practices|FAQ/Izenda-Update-Best-Practices]] * [[FAQ]] * [[Tutorials]] * [[The Izenda API|/API/AdHocConfig]] * [[The AdHocSettings class|/API/AdHocSettings]] * [Developer Links and Guides](/Guides/Developer-Links-and-Guides) * [[Known Issues]] --- * <a href="http://www.izenda.com" rel="nofollow" target="_blank">Izenda Website</a> * [Product Video](https://www.youtube.com/watch?v=X3-yWFq0w5A) * <a href="http://www.izenda.com/blog" rel="nofollow" target="_blank">Izenda Blog</a> * <a href="http://www.izenda.com/company/" rel="nofollow" target="_blank">About Us</a> * <a href="http://www.izenda.com/contact-us/" rel="nofollow" target="_blank">Contact Us</a> --- * [Guide To Report Design](/Guides/ReportDesign) * [Making Custom Forms Video](http://www.youtube.com/watch?v=5b2axJlgdFs) --- * [[Acknowledgements]]
Edit message:
Cancel