
#4.0 Fields Tab
##About
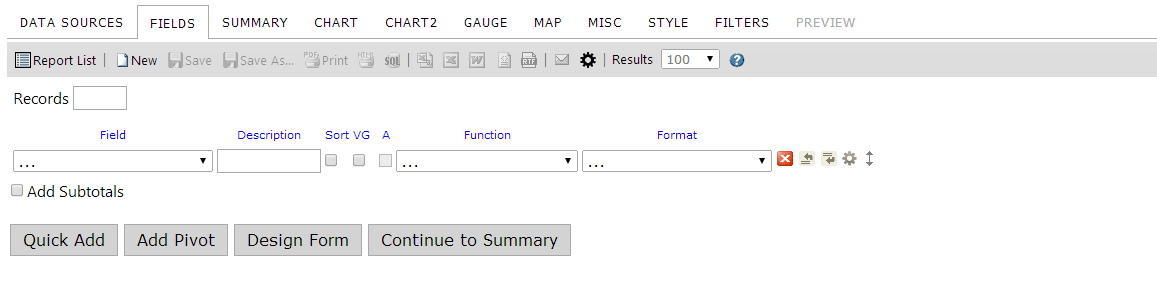
The Fields tab is where the actual report is built. This tab allows you to define which fields from your Data Source that will be included in your report and any grouping, sorting, and totaling that needs to be performed. There are a multitude of options that are available to users from this tab. Listed below is a brief description of the properties available on the Fields tab.
| Feature | Appearance | Description | |||
|---|---|---|---|---|---|
| Field Selection | 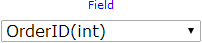 |
Select fields from the drop-down menu or use the Quick Add button | |||
| Description | 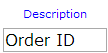 |
Sets the title to be used for the column. | |||
| Sort |  |
Sorts A - Z. | |||
| VG |  |
Visually Groups your data based on the selected Field. | |||
| A |  |
Arithmetic – Performs basic calculations (+, -, *, %) and concatenation of text. | |||
| Function |  |
Displays functions available based on the type of data being accessed. | |||
| Format |  |
Displays the formats available to be displayed based on the data type. | |||
| Other buttons |
 , , , , , , , ,
|
Enables you to delete, insert, or move fields as well as providing advanced options for the selected field. | |||
| Records |  |
Sets the number of records to display, which is used many times to add a Top to the query result, such as Top 10 Customers by Revenue | Add Sub-total | Adds a sub-total to the report under each numeric column | |
| Add Side-total | Adds a side-total to the report beside each numeric row | ||||
| Quick Add |  |
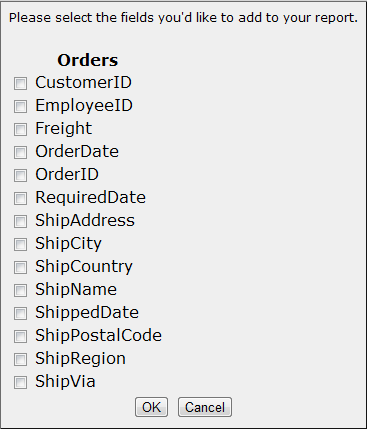
Lets you quickly add multiple fields to the report at one time | |||
| Add Pivot |  |
Displays the pivot controls. Learn more about pivots. | |||
| Continue to Summary | Continues to the next tab in the report design process, the Summary tab. |
Next, we will explain a bit more in-depth about each of the controls listed above.
##4.1 Field Dropdown Menu
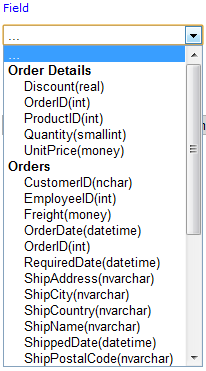
The Field dropdown menu is a list of the available fields in the table(s)/view(s) that are selected on the Data Sources tab. When working with multiple tables/views, the fields are categorized according to which Data Source they come from. The entries in the list that are in Bold are the table/datasource names. Next to each field, you may also see the data type, as shown below.
##4.2 Description
Automatically inputs the name of the associated Field that you selected. You have the option to change the description and it will appear as the new title when displayed. You can decide how wide the control is with the DescriptionWidth property.
##4.3 Sort, VG, & Arithmetic Check Boxes
The following table explains the Sort, Group, and VG Check Box features.
| Features | Description |
|---|---|
| Sort check box | Check this box if you want the table/view to be sorted in ascending order by the field selected in the Field dropdown menu to the left. You can also sort in descending order in the advanced properties. |
| VG check box | When checked, this option will cause the field that it is checked for to be separated into subheadings. This can better allow report viewers to easily see related data. See more about visual groups. |
| Arithmetic | Arithmetic. Performs basic calculations (+, -, x, %) and concatenation of text. More about Calculated Fields |
##4.4 Other Buttons on the Fields Tab
The  ,
,  , and
, and  buttons apply to the row that they are displayed in and allow you the flexibility to re-organize your data without creating a whole new report.
Below is a table that describes the function buttons of the Fields tab.
| Icon | Control Name | Description |
|---|---|---|
|
Delete button | Click this button to delete the row the button is on. |
|
Insert Row button (above) | Click this button to insert a row above the row the button is on. |
|
Insert Row button (below) | Click this button to insert a row below the row the button is on. |
 |
Move | Allows user to move a row up or down in the list |
| Advanced Properties | View advanced properties for that row. |
##4.5 Functions Drop-Down
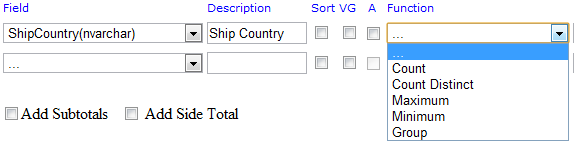
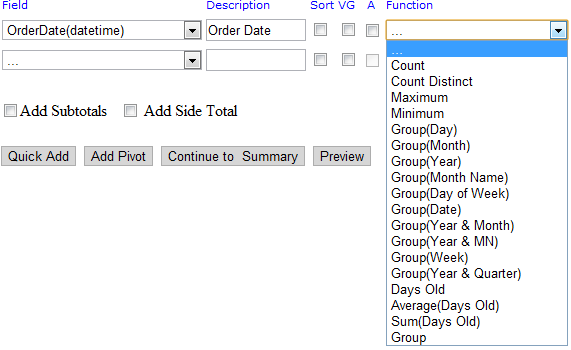
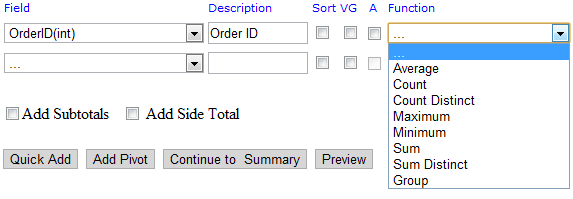
Functions allow you to perform calculations on the data and can be chosen from the dropdown menu based on the data type of the selected Field. Here is an article on SQL Functions
Text (String) Functions Available
Date/Time Functions Available
Numeric Functions Available
Functions Table
| Function Name | Description | |
|---|---|---|
| . . . | No function used | |
| Average | Average the values in a column | |
| Count | Counts the number of values in a column | |
| Count Distinct | Counts the number of distinct values in a column | |
| Maximum | Takes Maximum value of a field | |
| Minimum | Takes Minimum value of a field | |
| Sum | Sums the values in a column | |
| Sum Distinct | Sums the rows with distinct values in a column. | |
| Group | Groups field values together for aggregating | |
| Group(Day) | 23; day of month | |
| Group(Month) | 3; instead of March | |
| Group(Year) | 2012 | |
| Group(Month Name) | July | |
| Group(Date) | 7/4/2012 | |
| Group(Day of Week) | Sun or Mon | |
| Group(Year & Month) | 2012 -07 | |
| Group(Year & MN) | 2012 - Jul | |
| Group(Week) | Jul 01 – Jul 07 (Sunday to Saturday of Week) | |
| Group(Year & Quarter) | 2012–Q3 | |
| Days Old | 342 (Number of Days from Today’s Date) | |
| Sum(Days Old) | 782 (Sums the Number of Days from Todays Date) |
##4.6 Format Dropdown Menu
The Format dropdown menu is a list of formats for the entries of the field selected in the Field dropdown menu directly to the left to appear in. Depending on the Field data type and the function, you will have differing options for formatting. The main two formats used will be available for all numbers and dates.
Numeric Formats Available
| Format | Description | Examples |
|---|---|---|
| . . . | Displays the number as it is stored in the database | 500 |
| 0,000 | Displays as a whole number | 500 |
| 0,000.00 | Displays with two decimal places | $500.00 |
| $0.00 | Displays as currency with two decimal places | $500.00 |
| $/100 | Displays the Number / 100 In currency format. | $5.00 |
| 0.0 | Displays with one decimal place | 500.0 |
| 0.00 | Displays with two decimal places | 500.00 |
| 0.000 | Displays with three decimal places | 500.000 |
| 0% | Displays the number as a percentage | 50000% |
| % of Group (with rounding) | Same as % of Group but rounds to closest tenth (ex. 1.11547% would be 1.1%). | 100.0% (only one selected value, 500) |
| % of Group | Calculates the percentage of the row value to the entire group of values. | 100% |
| Gauge | Shows value in a Linear Gauge instead of a numerical value. | |
| Gauge (variable) | Shows values in a Linear Gauge which changes format due to values. The field you format supplies the value to be gauged, the next two numerical fields establish (respectively) the lower and upper boundaries of the gauge. | |
| Dash Gauge | Shows values in a Linear Gauge which changes format due to values. |
Date/Time Formats Available
| Format | Description | Examples |
|---|---|---|
| . . . | Displays the date as it exists in the database | 7/4/2012 12:00:00 AM |
| Short Date | Displays date using the mm/dd/yyyy format | 7/4/2012 |
| Long Date | Displays the day of the week, month, numeric day, and the year | Wednesday, July 04, 2012 |
| Short Time | Displays time as hh:mm AM/PM | 12:00 AM |
| Long Time | Displays time as hh:mm:ss AM/PM | 12:00:00 AM |
| Full(short) | Displays the Long Date format, followed by the Short Time format | Wednesday, July 04, 2012 4:34 PM |
| Full(long) | Displays the Long Date format, followed by the Long Time format | Wednesday, July 04, 2012 4:34:52 PM |
| D&T (short) | Displays the Short Date format, followed by the Short Time format | 7/4/2012 4:34 PM |
| D&T (long) | Displays the Short Date format, followed by the Long Time format | 7/4/2012 4:34:52 PM |
##4.7 Quick Add
Quick Add lets you add multiple fields to the report at one time by selecting from a list.
##4.8 Advanced Field Settings Button
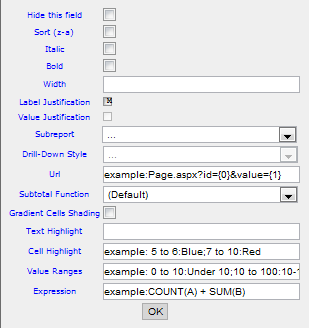
To access the Advanced Field Settings, click on the Gear icon on the selected Field.
| Setting Name | Description |
|---|---|
| Hide this field | Hides the field from display when report the is ran. Useful for using expressions on multiple fields but when only one of the fields should be displayed. |
| Sort (z-a) | Sorts in descending order |
| Italic | Sets whether the column is shown in italics |
| Bold | Sets whether the column is shown in bold |
| Width | Set the width of the column in number of pixels |
| Label Justication | Sets the Column label to the left, right, or middle of the row |
| Value Justication | Sets the Value of the field to the left, right, or middle of the row |
| Subreport | Sets the drill-down child report. The list contains only reports that have a drill-down key set for them. Note: The "Automatic" option will attempt to choose a sub-report by matching the drill-down key to the selected field and cannot discern between two sub-reports that use the same drill-down key. |
| Drill-Down Style |
Link – opens in same browser window Link (New Window) – opens in new browser window Embedded – embeds the drill-down results into the main report Popup – opens the results on a pop-up screen Hover - Shows the sub-report when you hover the mouse over the item that the sub-report is linked to |
| Url | Allows you to define a custom Url to redirect to when the sub-report is accessed. |
| SubTotal Function | Sets a customized function for subtotals displayed with this field. The default value is "Sum". This only applies to the bottom sub-totals and not the side sub-totals. |
| Gradient Cells Shading | Sets whether cells will use a gradient or solid colors for shading. The larger the value in the cell is, the darker the shading will become. |
| Text Highlight | Highlights the text for a given range. You can refer to the Styles tab for a list of valid colors. Example: "5 to 6:Blue;7 to 10:Red". |
| Cell Highlight | Highlights the entire cell for a given range. This follows the same rules as text highlight. |
| Value Ranges | Lets you set text values for number ranges. (i.e. setting this to 0 to 10:Under will display the text "Under" when it encounters a value between 0 and 10 for that column). |
| Expression | Allows you to define a customized mathematical or SQL expression to show as the value for the column cells. See more about Expressions |
##4.9 Add Pivot
The Add Pivot button allows you to generate analytical data grids and essentially adds extra columns to the right side of the report. These extra columns are based on the logical grouping function that you can define in your pivot. (e.g. pivoting a money column with a Group (Year) function will display each year's total for as many years as exist in your dataset.
##4.10 Admin Tips
Here are some additional resources that admins can use to increase readability and more precisely define what data users are allowed to view.