
#2.0 Quick Start Guide
##About
The following section will demonstrate the basic capabilities of the Report Designer and how to create both simple and advanced reports.
##2.1 Building your first report
Before we begin creating a new report, you can visit our demo site to begin following along. Once you have done that, come back to this guide and follow the additional steps. Alternately, you can watch the video below to begin creating your first report.
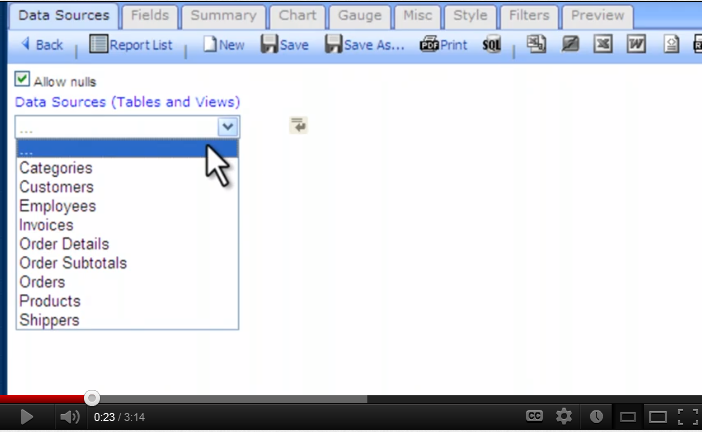
To begin creating a new report, simply click the "+New" button on the Report List. You will then select "Report" from the menu that appears. You will be directed to the Report Designer.
Here, you will see that you have landed on the Data Sources tab. More information is available by clicking the link. For now, select Orders. Then click "Continue to Fields".
Now that you are on the Fields tab, select the fields ShipCountry, ShipCity, and Freight in the dropdowns on the page. This will add the fields to your report. Notice that when you select a field, a new set of controls appears below to allow additional selections. This and other features are covered more in Section 3, referenced above.
You're almost done with your first report. You may now click Preview to see what your report will look like to anyone who views it.
You can now click Save As… on the toolbar to save your new report. You must enter a name for your report, but the category is optional. If you opt not to select a category, the report will be Uncategorized.
You now have your first functional report. This is a very basic example, and Izenda Reports offers many more capabilities, described throughout this guide.
2.2 The toolbar
While saving your report, you may have noticed there are many other options there besides just saving the report.