
#13.0 Izenda Maps
##About
The Izenda Maps add-on provides interactive geographical visualization to the reporting experience. For more information, please click here.
Note: You must have purchased the Maps module to access this functionality.
##13.1 Creating a Map
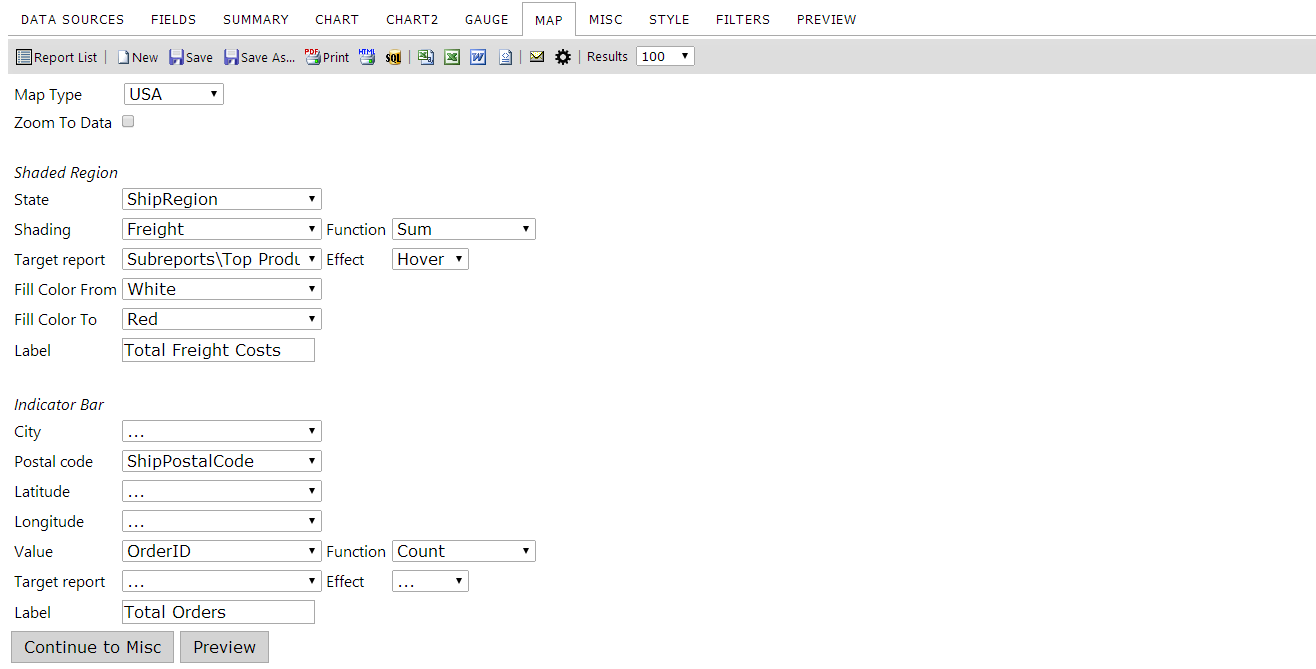
In the report below, we are shading the colors of the states based on the sum of the freight, applying a hover over that shows the top products by state, and displaying an indicator bar on the location of the postal code while showing the number of orders vertically in the bar.
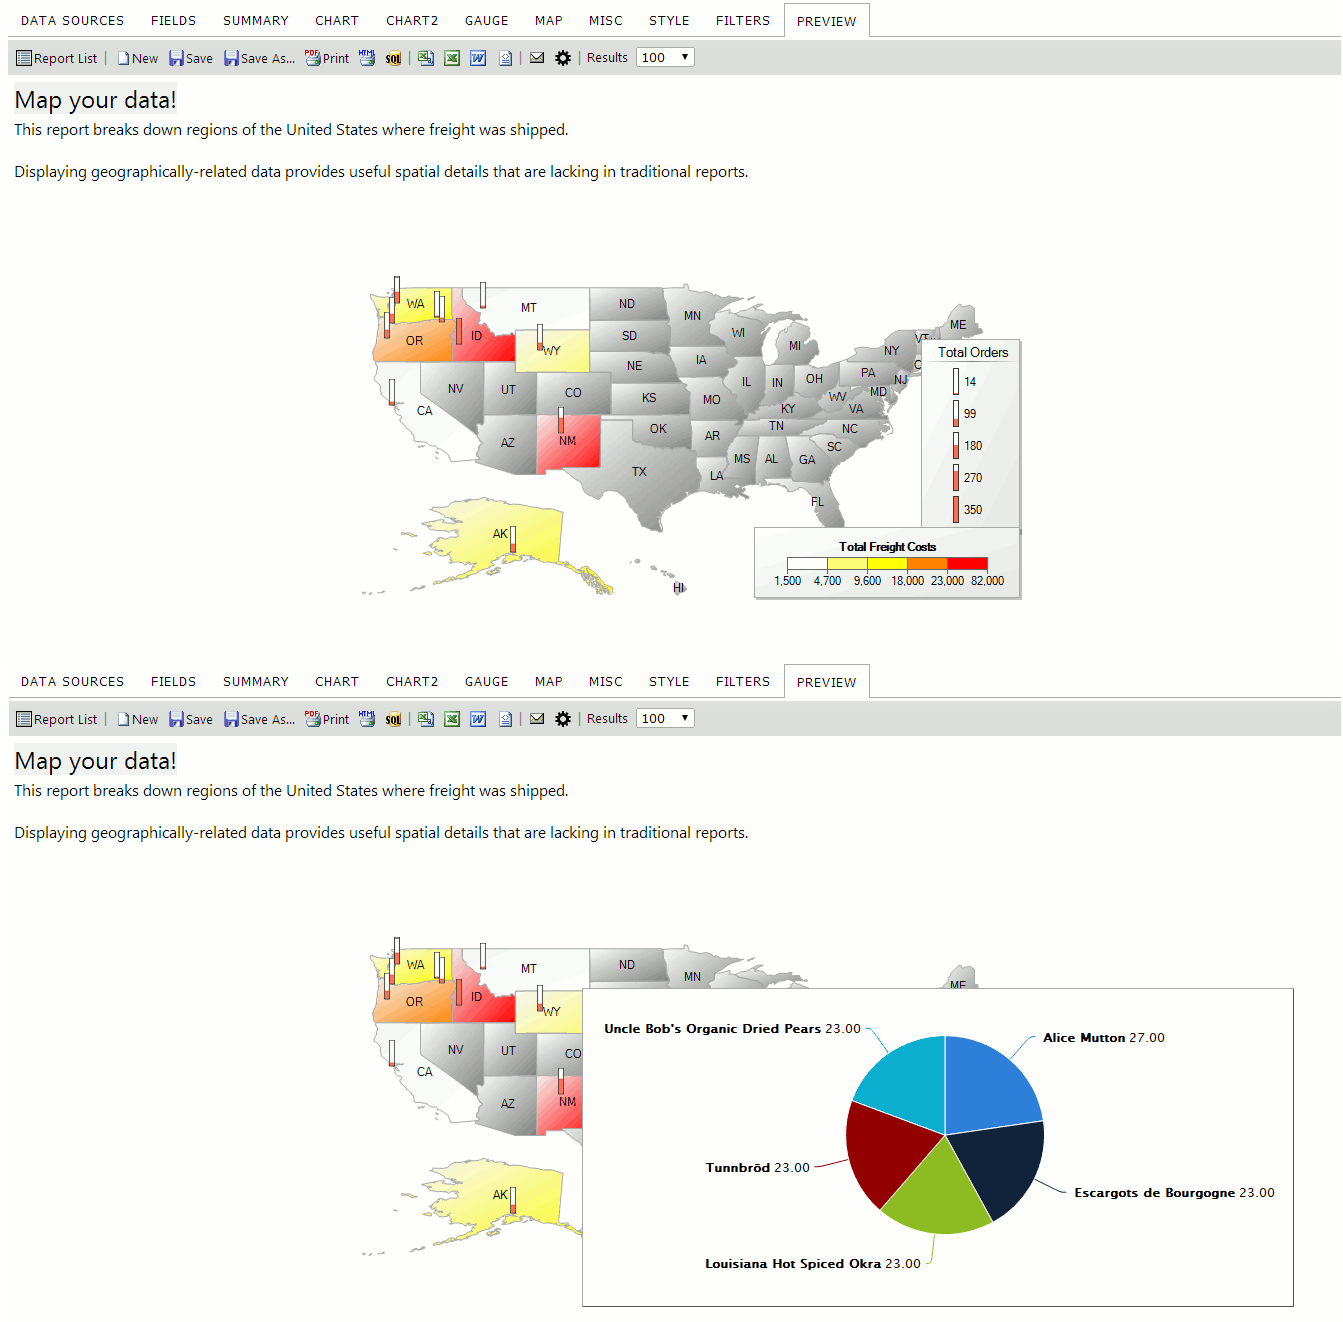
The result of the map in the above example is shown below. You can see that a subreport can be set to display on the map. This one shows the top products for each state.
##13.2 Maps features
| Feature | Description |
|---|---|
| Map Type | 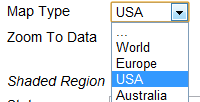 |
| Zoom to Data | Zooms to the region or state the data is in |
| State | Select the field where state data is located |
| Shading | Selects the field and function you will use for shading |
| Fill Color From - To | Fills the color of the shading from a selected color to a selected color |
| Label (1st one displayed) | Sets the text displayed for the Legend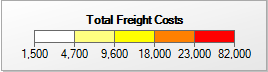
|
| Postal Code | Select the field where postal code data is located |
| Latitude / Longitude | Select the field where GIS data is located for lat/long |
| Value | Sets the field and function you will use in the indicator bar |
| Label (2nd one displayed) | 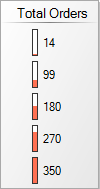 |