
#Introduction
Izenda now offers a BETA version of the new Instant Report Page in Angular.js with the platform’s latest update to 6.10.0.1. This beta release is made available to allow a broad user base to evaluate and give us feedback on the future of the Report Designer, but is not recommended for production use at this stage. This is not a fully supported feature however and any product defects will be noted, but not slated for immediately scheduled work.
Izenda will be continually making improvements and enhancements to the features and functionality with each maintenance release during the Beta phase. These items will be contained in our general maintenance release so our clients can follow in the progress. The most immediately visible change to Instant Reports is the new screen design and left side navigation bar. These have panels that will open with additional menu items and can collapse giving maximum visibility to the report being designed. For the initial BETA version the scope of the designer is limited. There are functions that a user cannot complete in the Instant Report page that they may need to move to the full Report Designer page to complete. A list of these major features are included in this guide.
Any report created in the new Instant Report page can also be edited in this page. If a new report is created in the new Instant Report page, the application will first open it for editing in the Instant Report page. At any time if the report is edited in the Report Designer it will only open in the full Report Designer for editing.
#Installation The new page is include in all 6.10.0.1 Reference Implementations for download. The new page can be configured for review using the following setting in the global file:
-
WebForms AdHocSettings.InstantReport = "InstantReportNew.aspx";
-
MVC AdHocSettings.InstantReport = "InstantReportNew";
-
VB AdHocSettings.InstantReport = "InstantReportNew.aspx"
This will change the current Instant Report page to the BETA Instant Report Page when navigating from the New Drop Down menu.
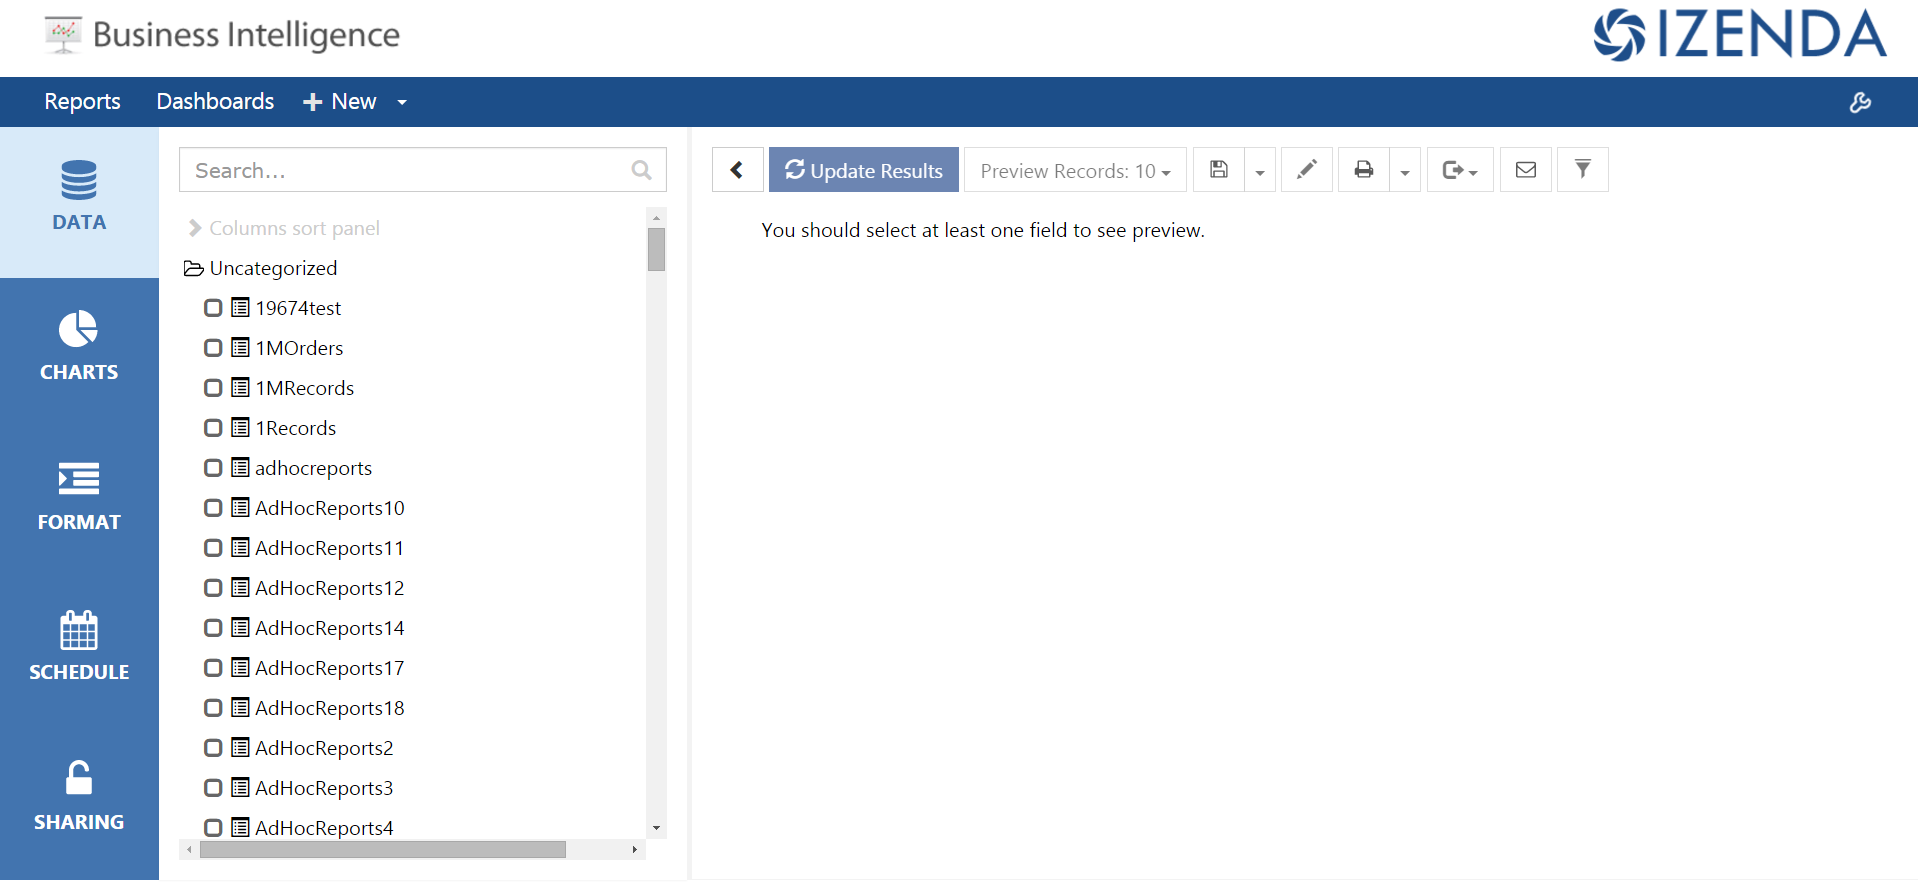
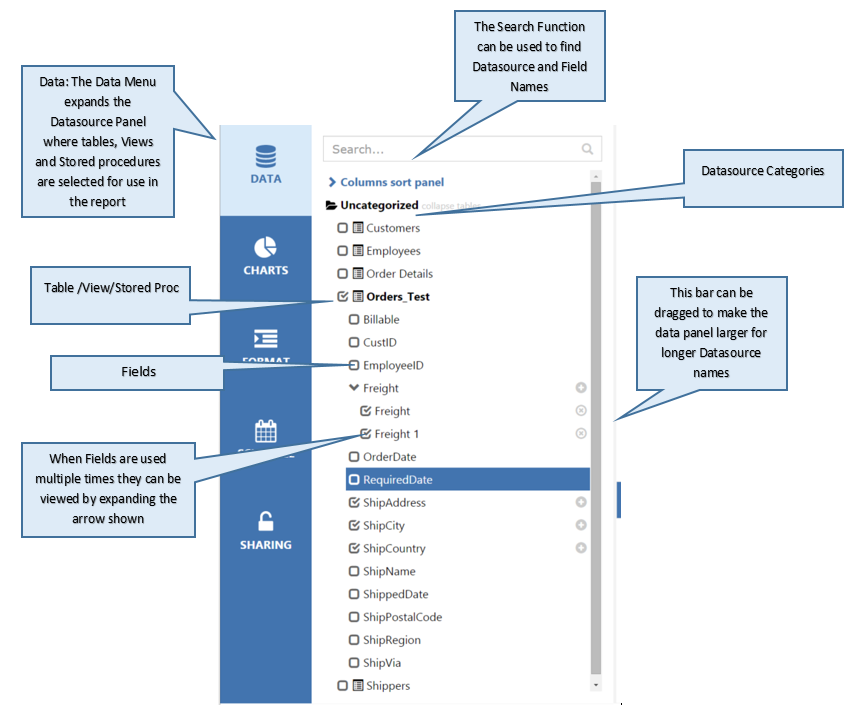
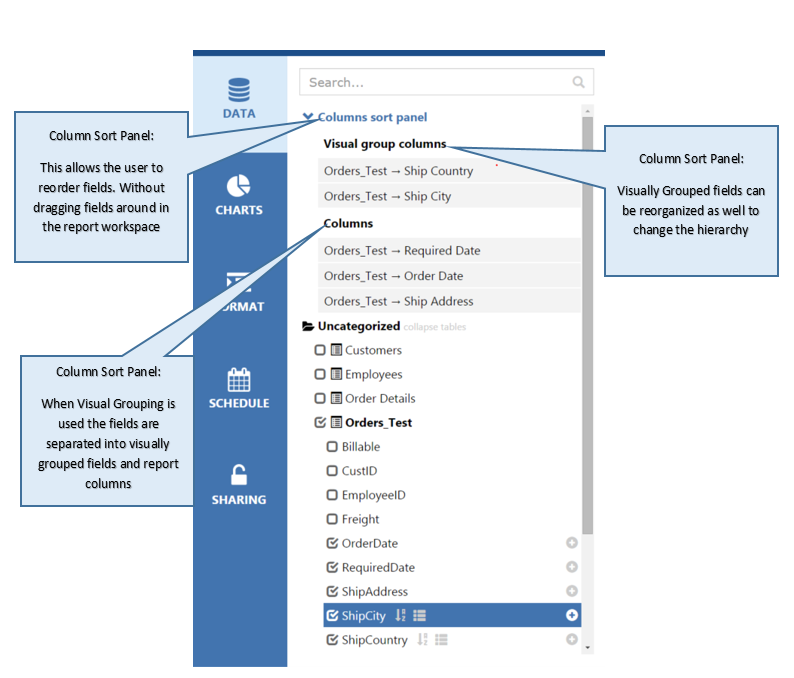
#Data
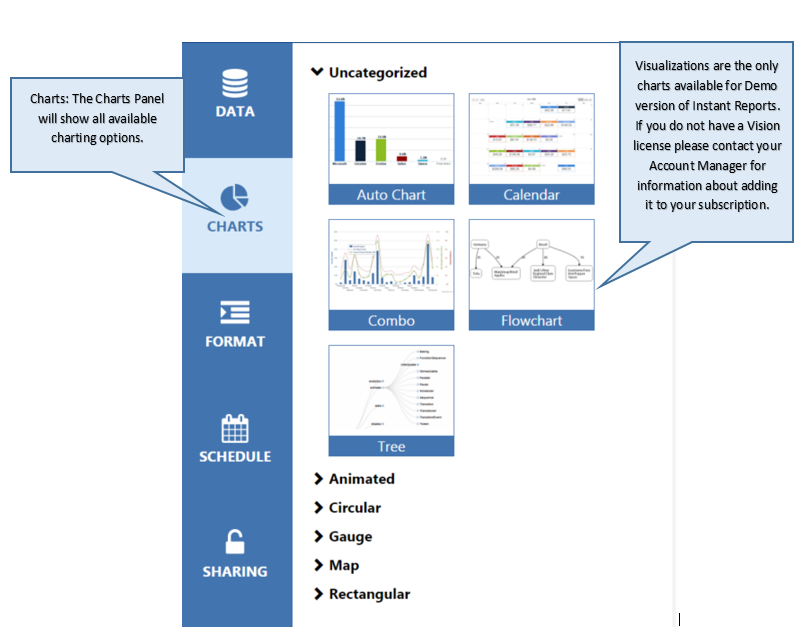
#Charts
#Formatting
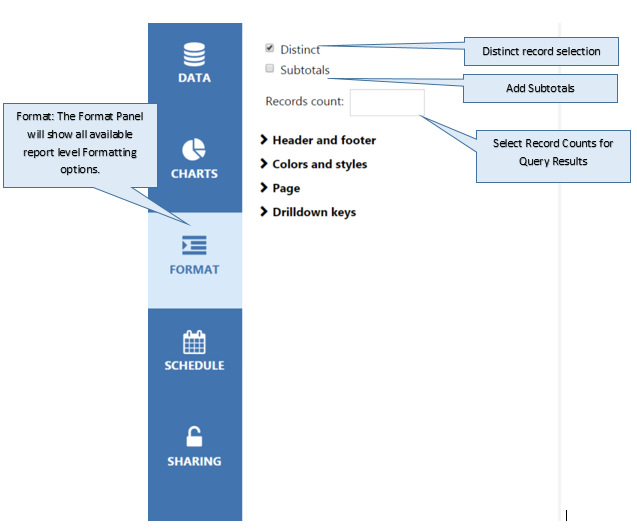
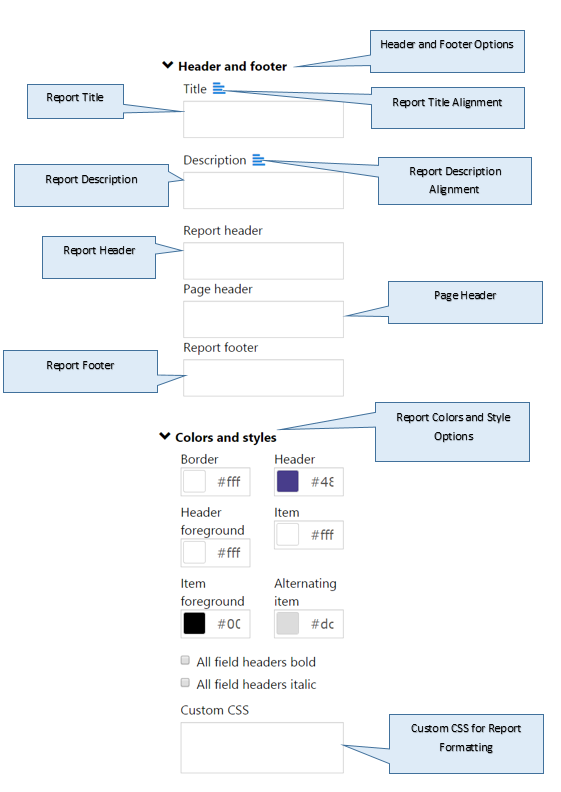
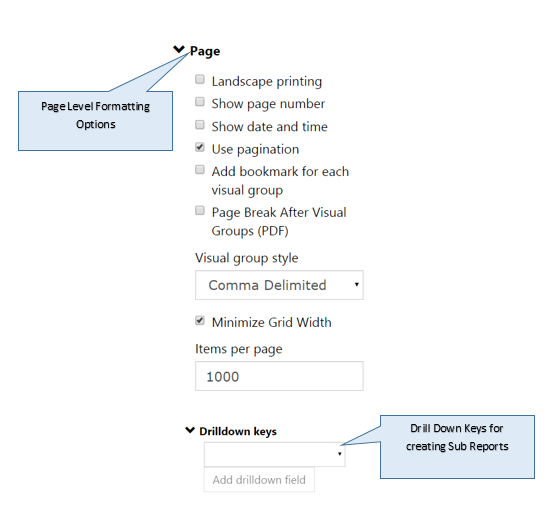
#Scheduling
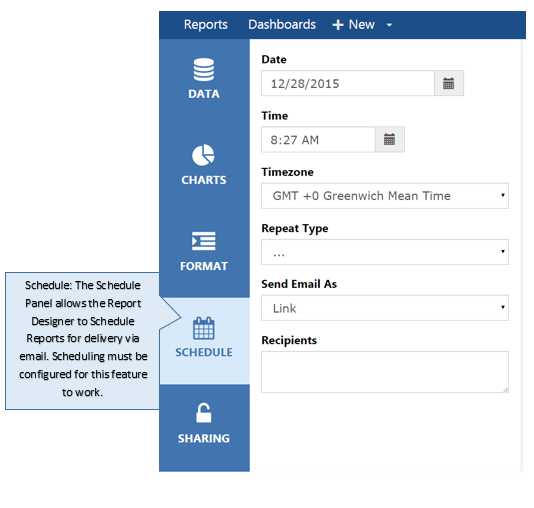
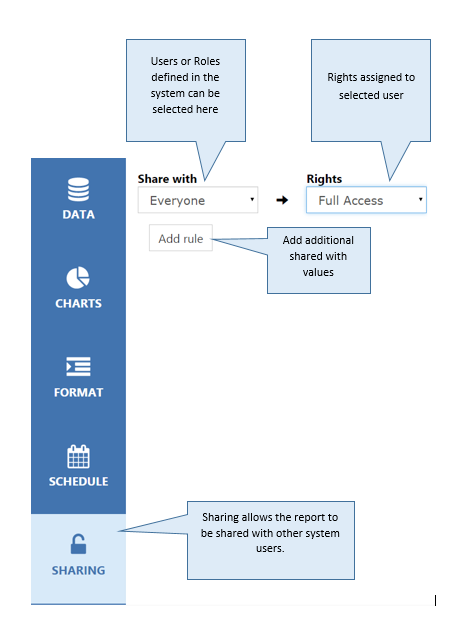
#Sharing
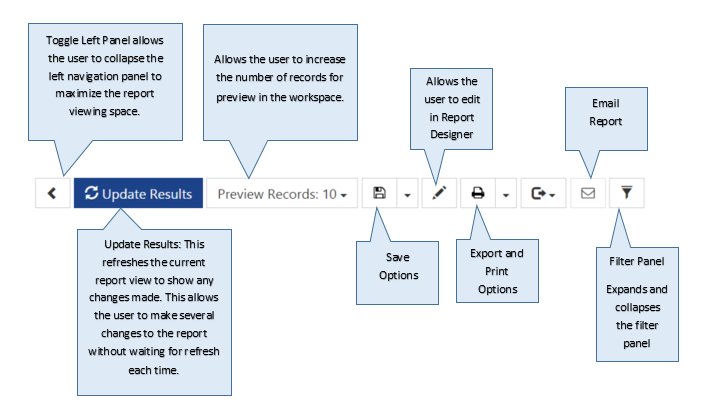
#Toolbar
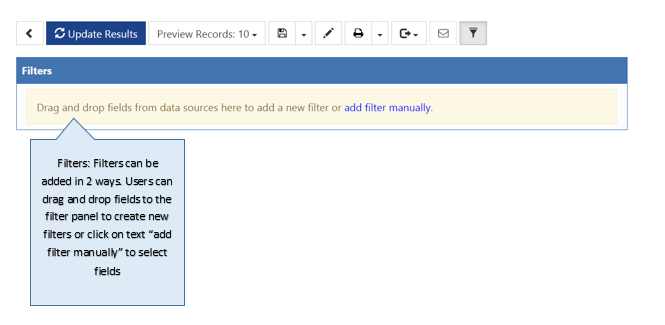
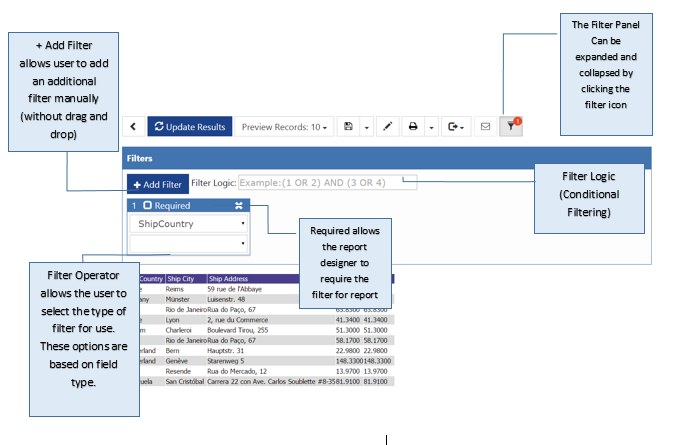
#Filtering
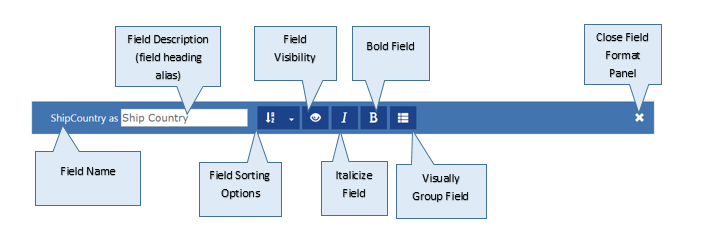
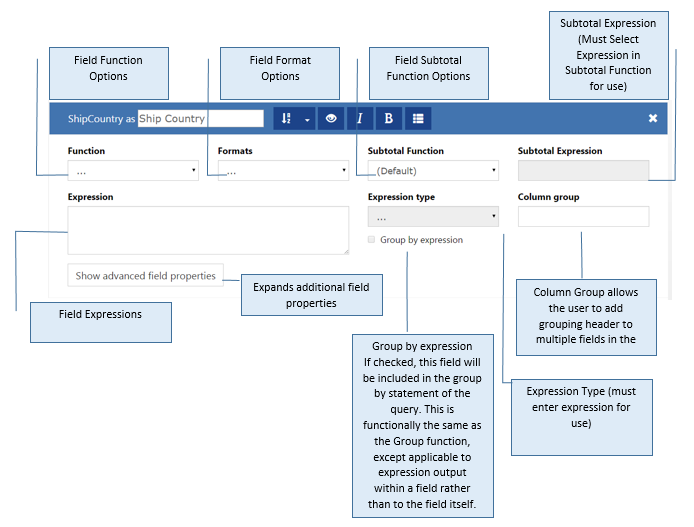
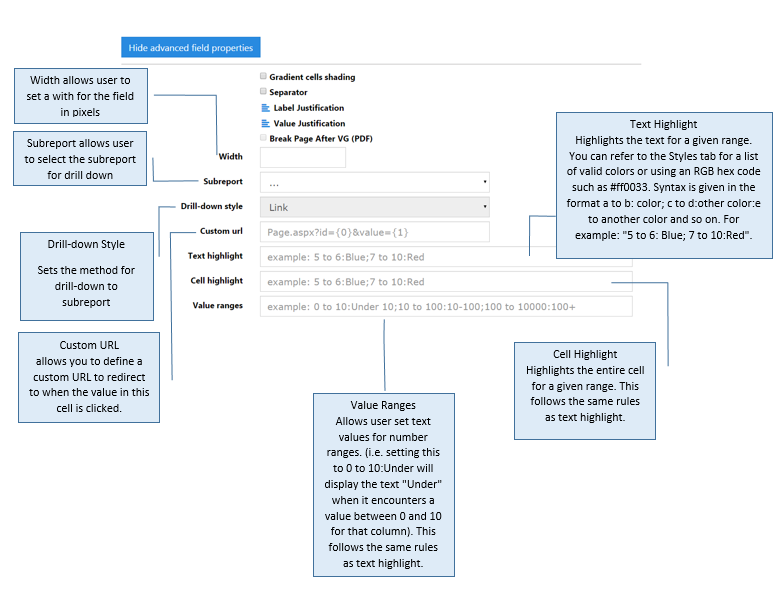
#Field Settings - Prior to 6.10.0.3 Release
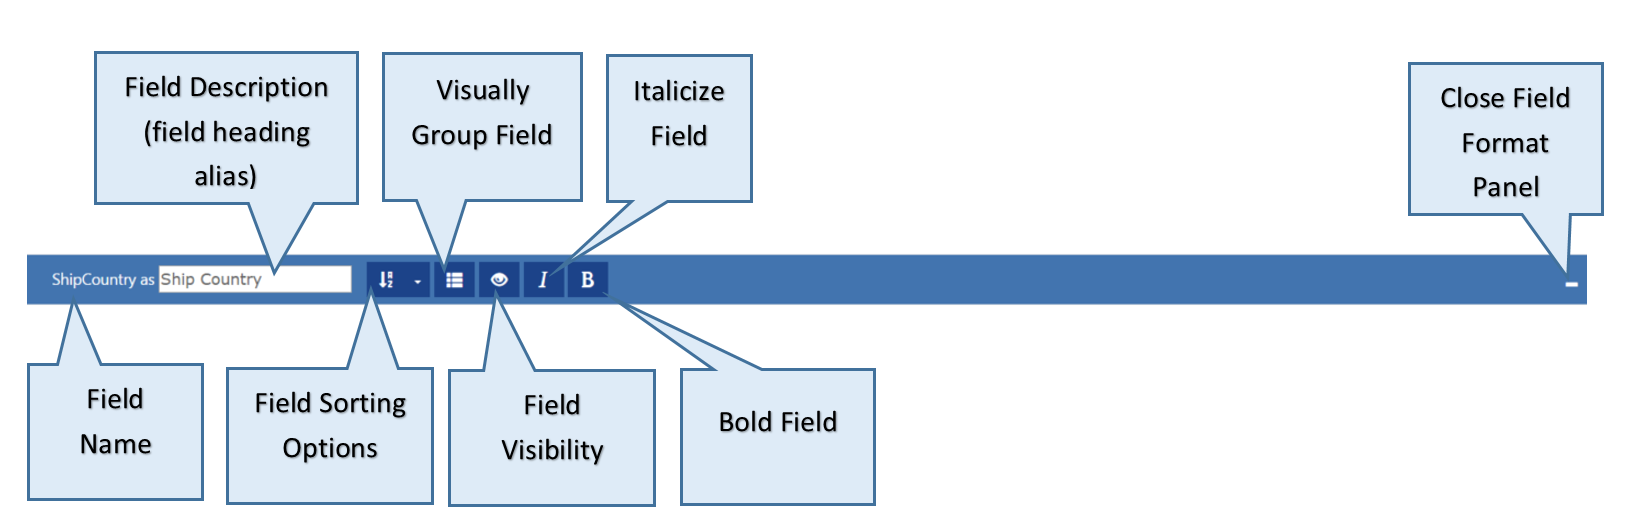
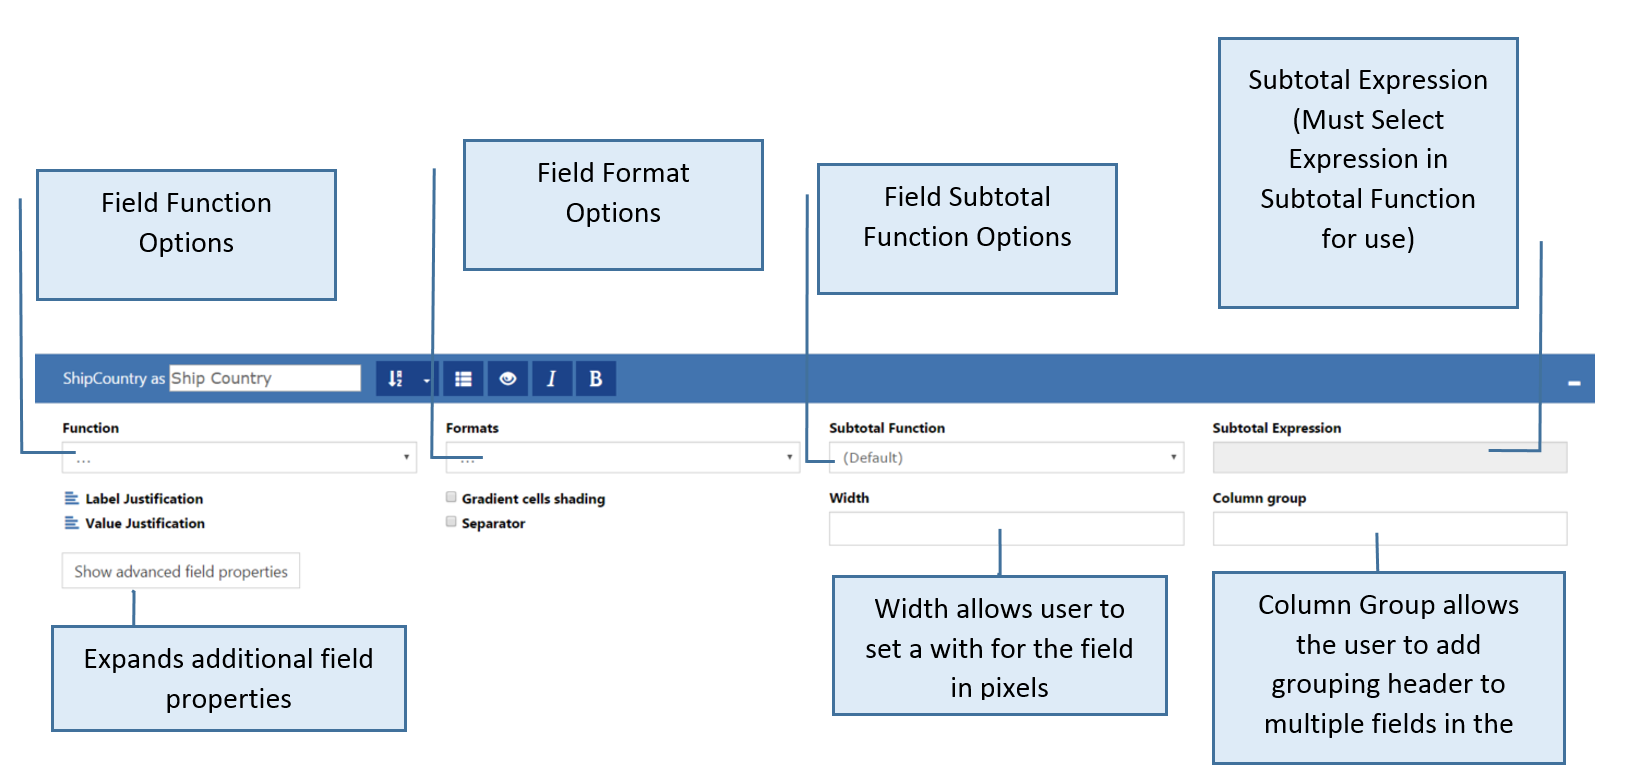
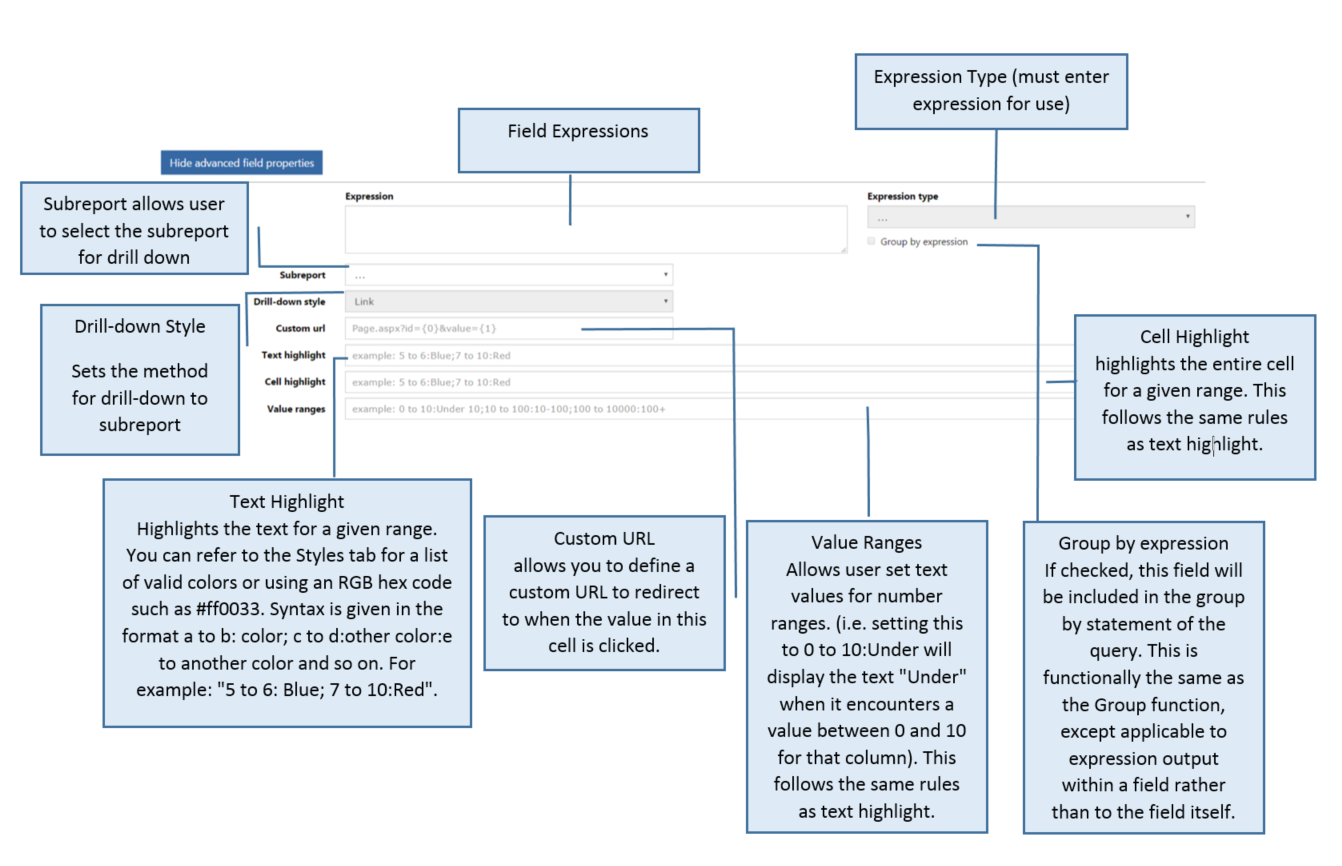
#Field Settings - Updated 6.10.0.3 Release
#Adding a Pivot - Added 6.10.0.3 Release
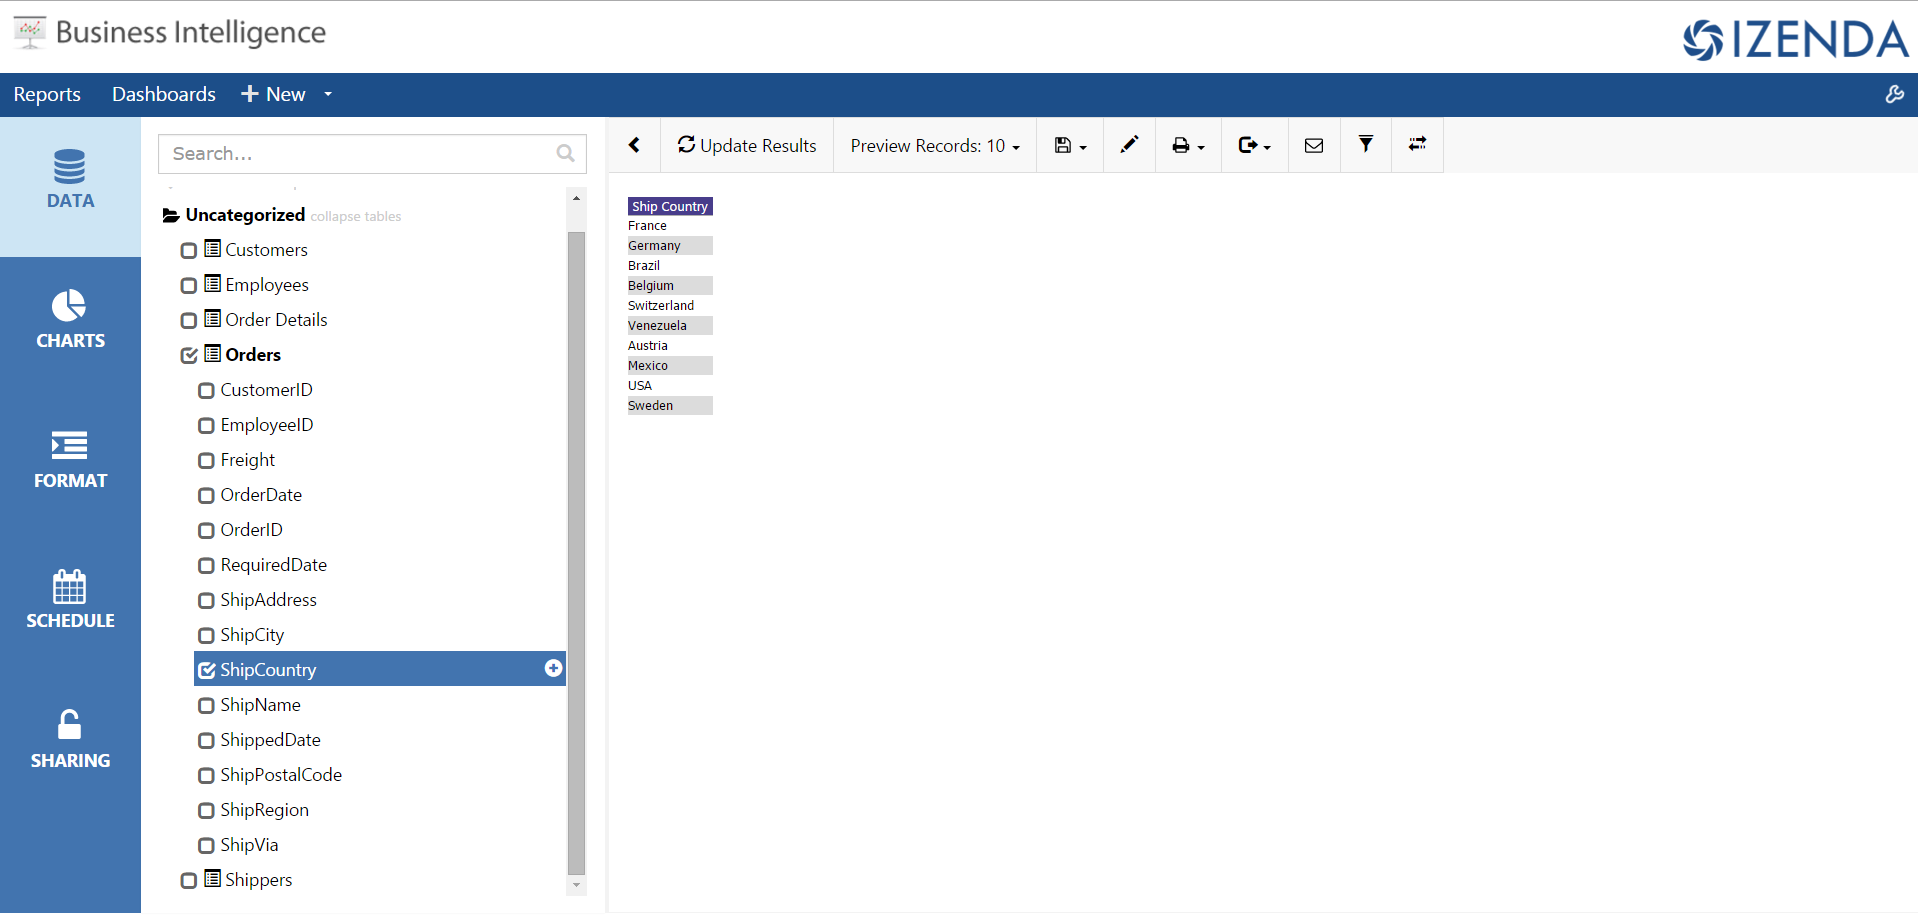
To create a pivot the user must first select at least one column in the report. This will show as the Rows in the Pivot grid. See below:
Next, click on the Edit Pivot Button shown below:
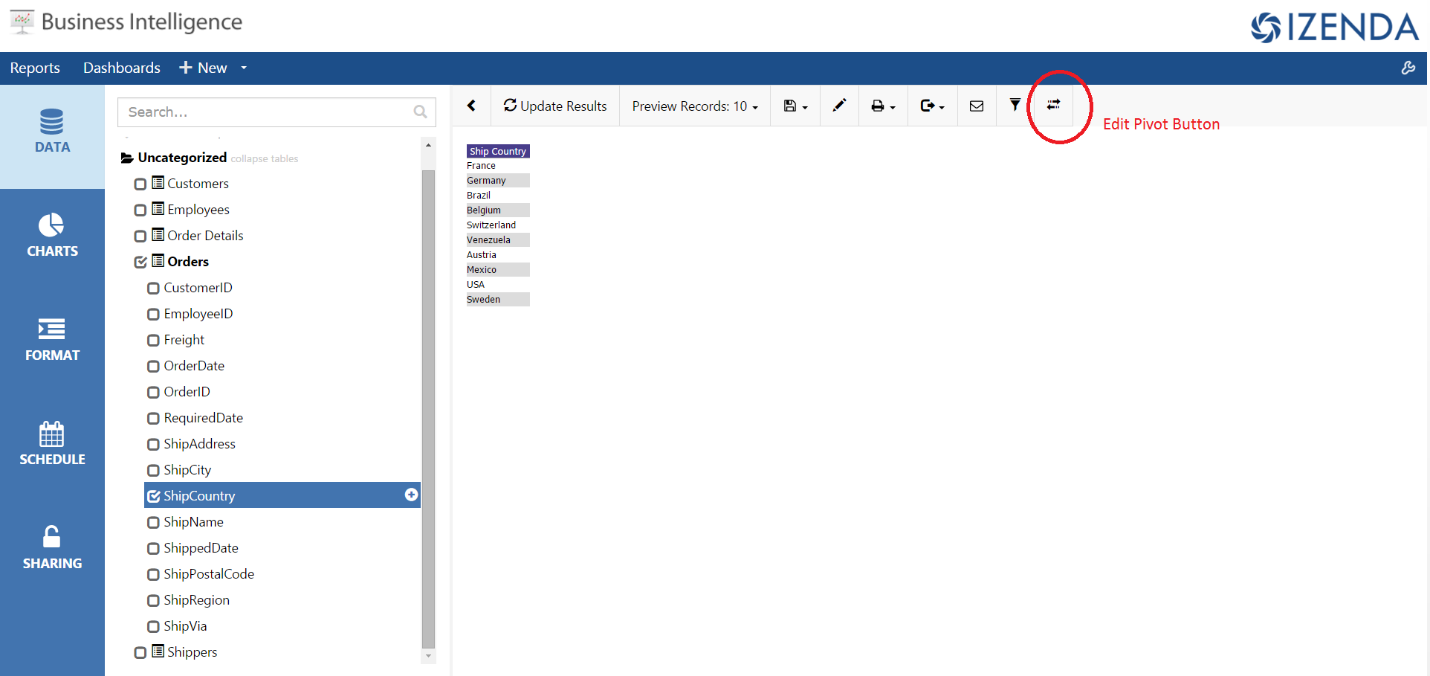
This will open the Pivots panel to allow the user to select Column and Pivot values.

Next, add the Pivot column and the grouping style for the column. In the example below we will add a field called Order Date in the Northwinds Database and choose to group by the year of the order date.

Now we want to add our pivoted values. Click on the +Add Cell Value button and a new field selector will be added to the panel.

Now you can use the drop down to select a field to show in the body of the pivot. We will show Freight from the Order Table and chose to sum the value of freight.
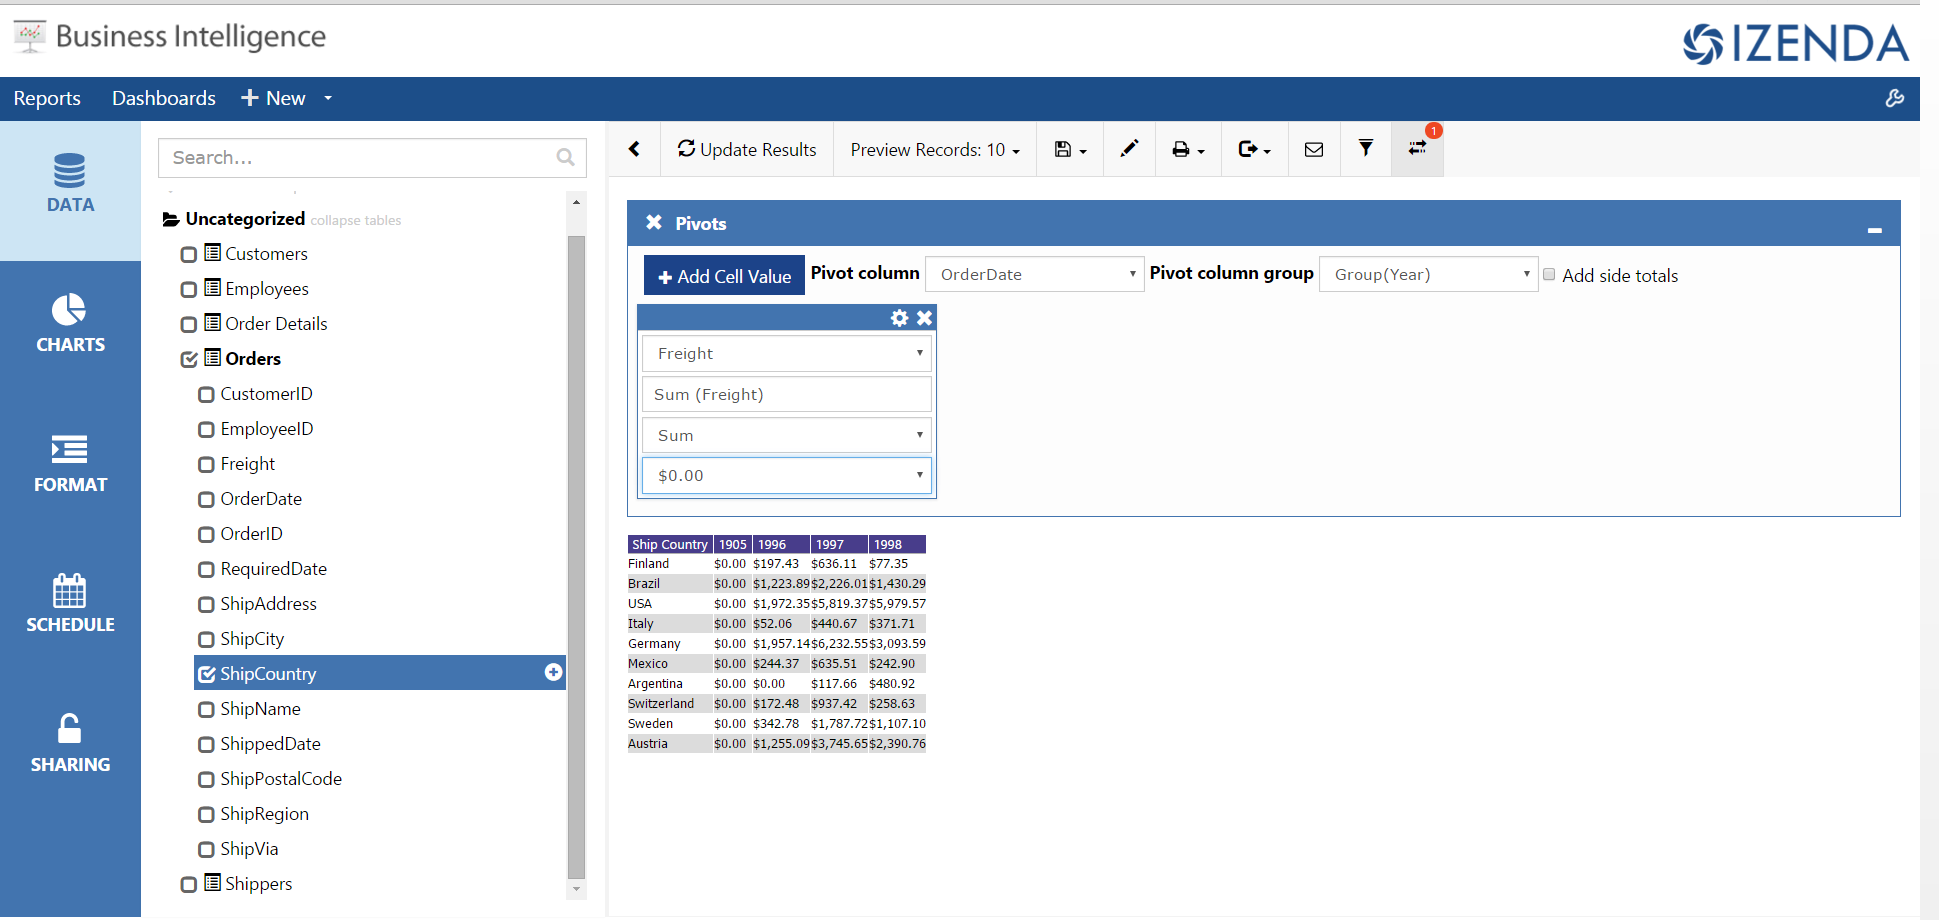
Now you can see the pivot is showing Each Ship Country and the sum of Freight by Order Year.
Additional values can be added to the pivot by clicking on the +Add Cell Value button, below we will show a count of Order ID for each Country by year.
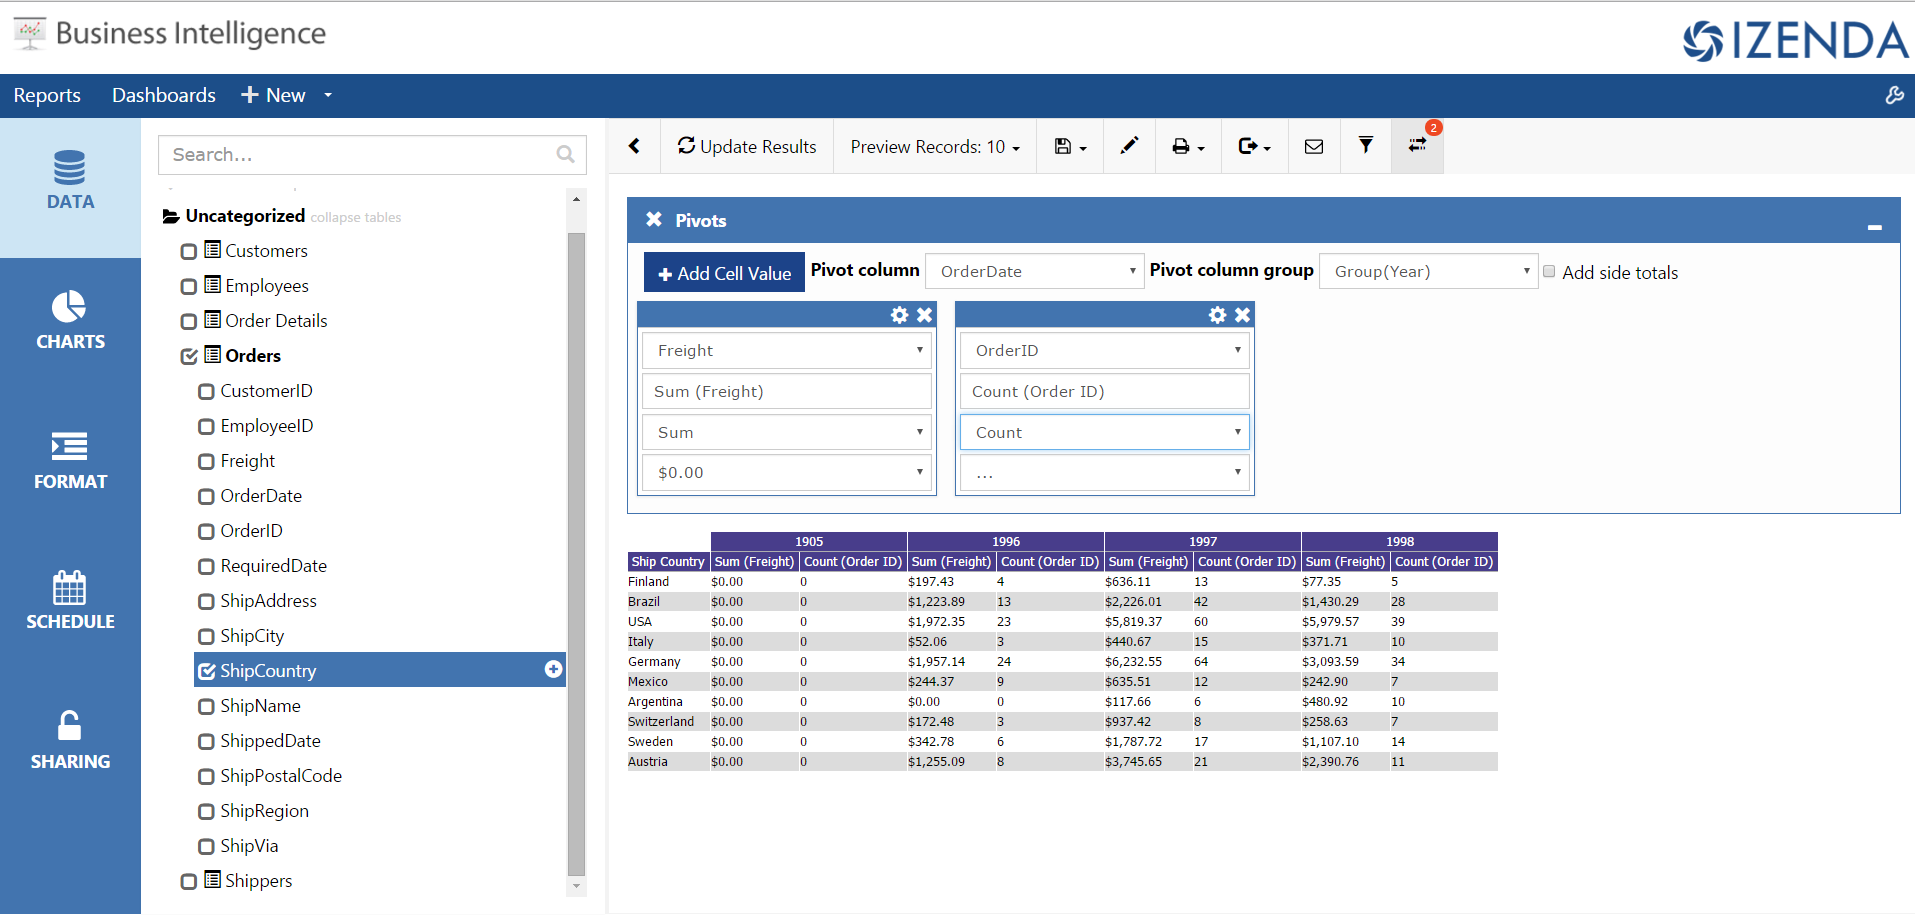
This panel can be collapsed by clicking the – icon in the top right corner of the Pivot panel shown below.

Notice you can still see a count of pivoted values when the panel is collapsed. If you need to edit the Pivot you can click on the Edit Pivot Button again to expand the panel.
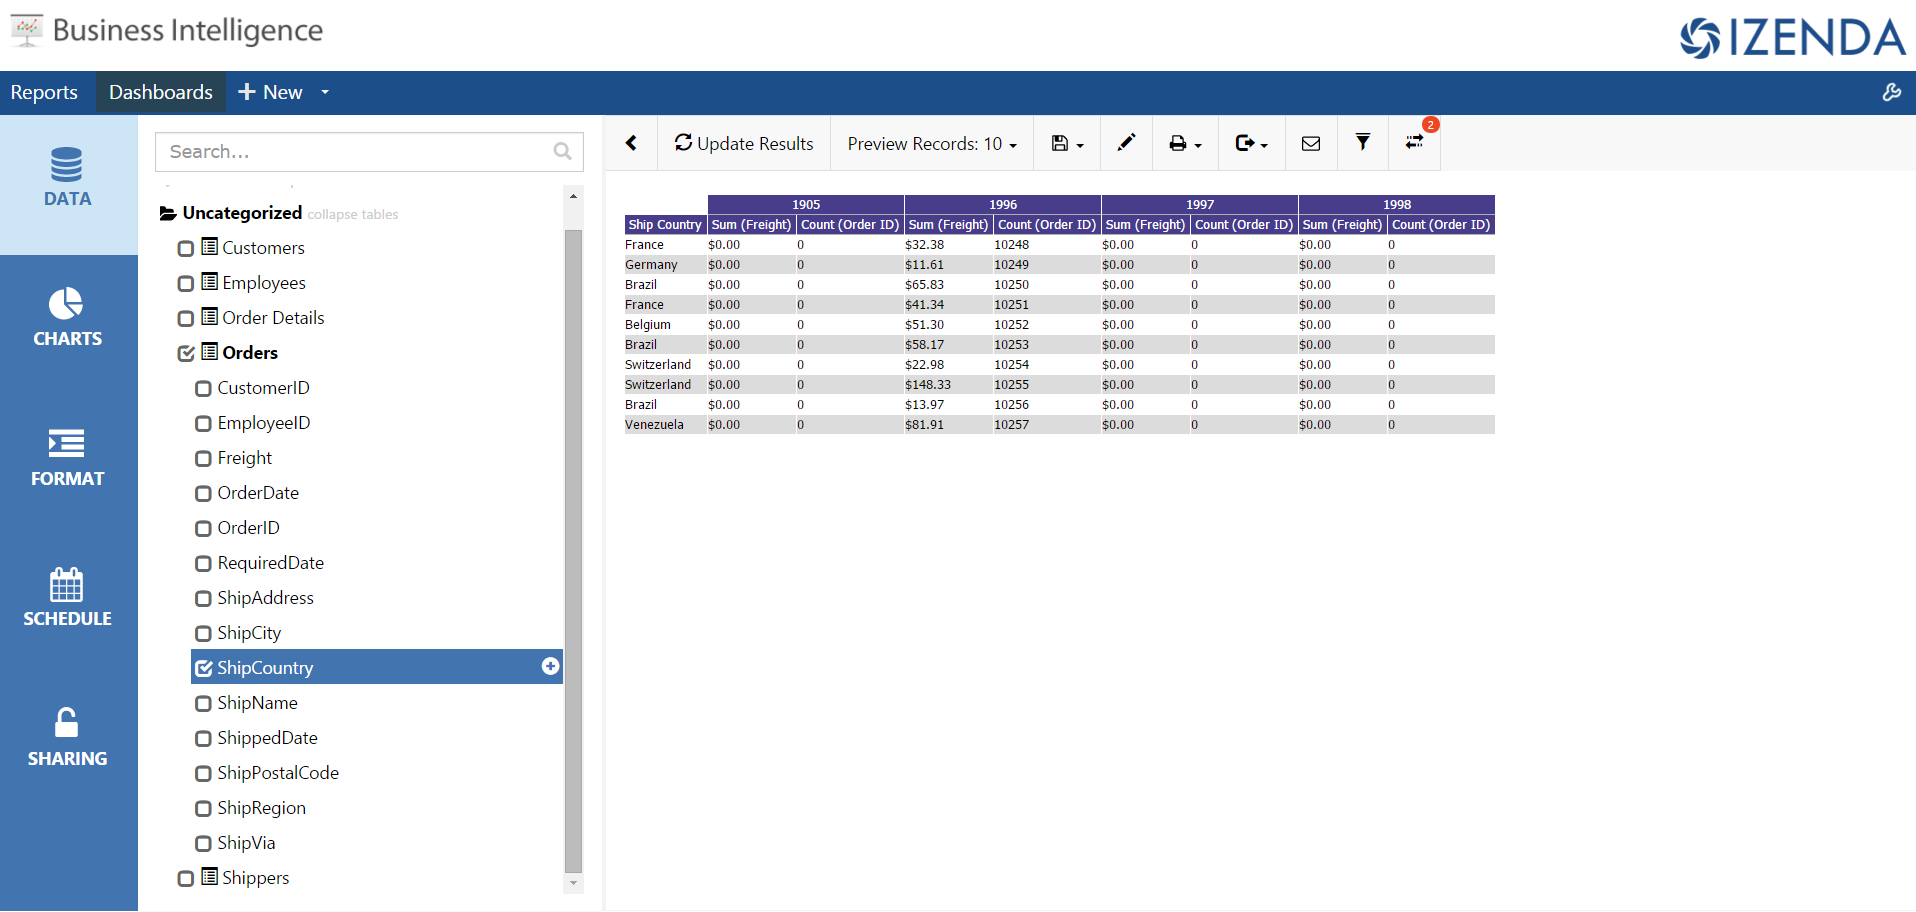
To remove the Pivot you can click the “X” on the top left corner of the Pivot panel header shown below:

This will remove the Pivot Column and the Pivot Values from the Pivot panel as shown below:

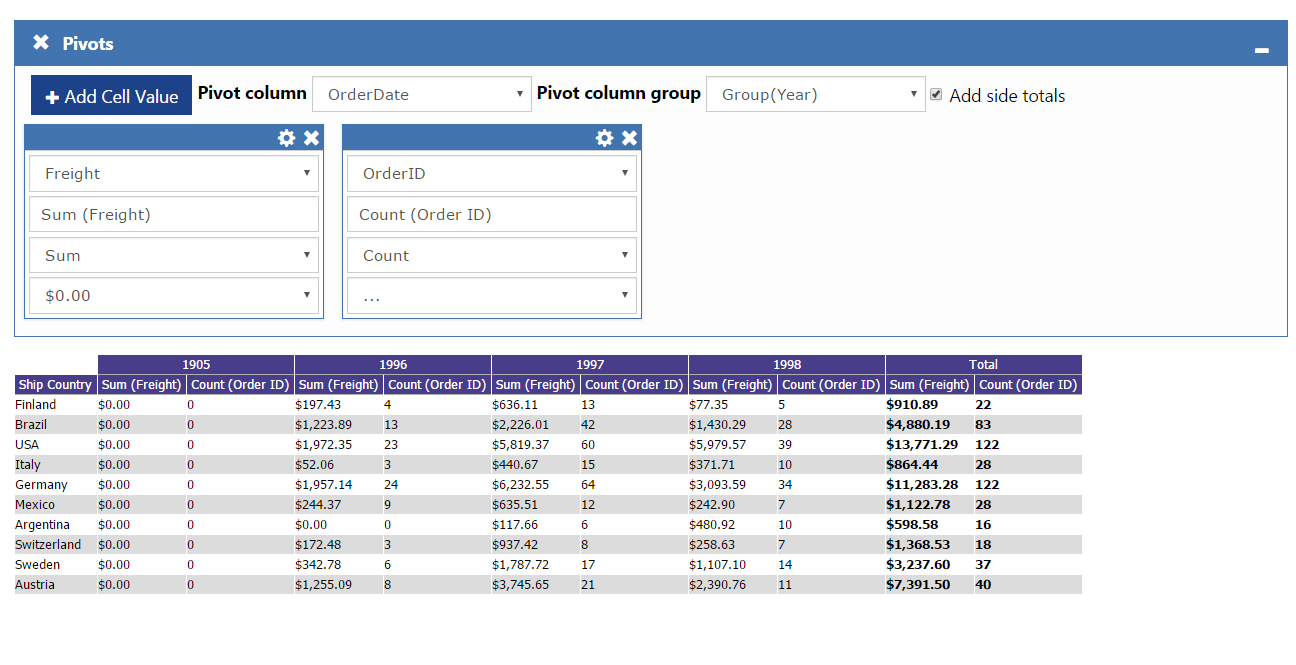
You can add side totals to the Pivot by clicking the Add side totals check box in the Pivot Panel shown below:
#Unsupported Features
At this time in the Beta Release of Instant Reports 2.0 the following Report Designing Features are unsupported. We will be building out features as we move forward to a production release.
*Advanced Datasource Joining Functionality
*Only Reports created in Instant Reports 2.0 without any edits in the Report Designer can be opened in Instant Reports. Once a report is edited in the Report Designer, it can no longer be edited with the Instant Report Designer.
*HTML Charts / Dundas Charts
*SQL Query Export
*Forms Design / Edit
*Language Translations
*Report Summary
*Adding Multiple Charts
*Adding Summary Grid