
#Customize Chart Colors
##Purpose
Customizing the chart colors allows you to inject a bit of your own branding, or any other color scheme for that matter, into Izenda's reports.
##Example
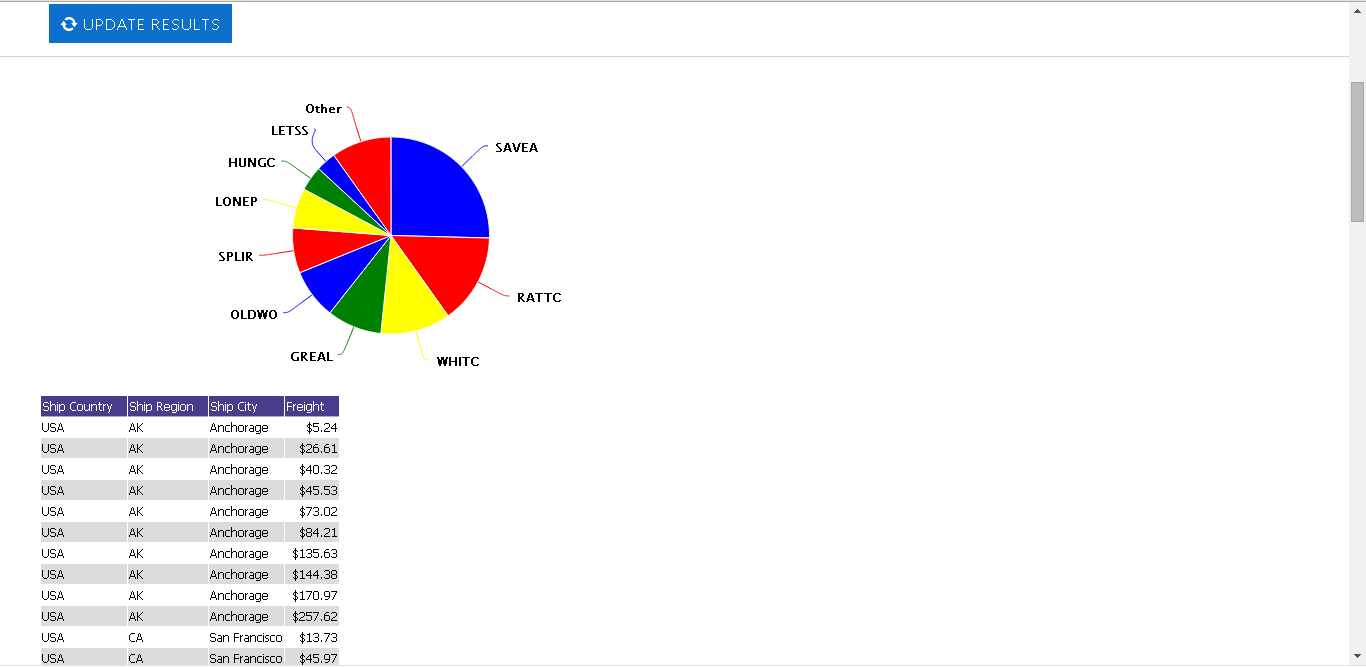
This image depicts a pie chart with custom colors set to Blue, Red, Yellow and Green.
##Implementation
The following code snippet should be added to the default.master page in a webforms implementation, or in Views/Shared/_SiteLayout.cshtml in an MVC implementation:
<script type="text/javascript">
  htmlChartColors = ['Blue', 'Red', 'Yellow', 'Green'];
</script>
This would achieve the color scheme from the example image above.
As a caveat, you will need a recent copy of the Izenda core product. This ability was added in 6.7.0.264, and can be downloaded here